
Written by the Internal Data & Analytics/Data Team
At Funnel, we’re used to going out on a limb and tackling challenges as they come. But by the end of 2024, we were starting to feel some growing pains in our internal data and analytics setup.
Our innovation had slowed and we were in maintenance mode, ownership of data definitions was fuzzy and different teams had started building workarounds to our data stack’s limitations instead of us improving the platform. People looking for insights in business intelligence tools were often making incorrect assumptions and getting inconsistent results.
It was tough to admit, but the trust in our internal data was gradually eroding. As an example, we found that there were at least three separate definitions of “active users” being reported in different parts of the organization, using the business intelligence tools that we were owners of.
For months, each version of the same metric was being used to inform strategic decisions. It came to a head when our CTO compared two of them side by side ahead of an all hands meeting and saw two different results. Neither of them were technically wrong, but our platform’s credibility took a hit.
It was clear that we needed to start making some changes.
The existing Business Intelligence and Product Analytics roles were merged into a centralised team tasked with serving the company with high quality internal product data and were assigned new roles as Analytics Engineers. In this new constellation, we agreed on a goal: “give everyone access to data they can trust and insights they can rely on”.
We put together a plan in which our new team would take control of the full value chain - from extraction to visualization - for all core business data. In parallel, we would help product teams take on some new responsibilities that would restructure how internal data was produced and consumed. To top it all off, we also committed to building a new data platform in AWS from the ground up to give ourselves a fresh start.
A year later, here’s what we achieved and some of the impact we have already seen.
Distributing Ownership & Rethinking Ingestion
We collaborated with product teams to create a Data Mesh inspired data landscape for the company. What we needed was buy-in from each team to adopt the role of a data producer, ensuring that our platform is built on trustworthy datasets that every data consumer can work with.
The current expectation is that each data producer, being the domain experts, should maintain a set of first-order data products with clear and consistent schemas that can be relied on to describe each product domain. These data products are updated daily and intended to be built in a way that requires minimal context and processing for the average data consumer (and the data producers themselves) to get value from them.
In line with this change, our team of Analytics Engineers took on the role of data producer for any remaining data sources that don’t have a natural ownership fit with other teams, such as our CRM, behavioral analytics and payment processing systems.
Our approach has been a mix of buying and building – some needs are serviced by Funnel’s own connectors and for the rest we have drawn from tons of in-house experience developing imports from external APIs to build our own pipelines for data ingestion.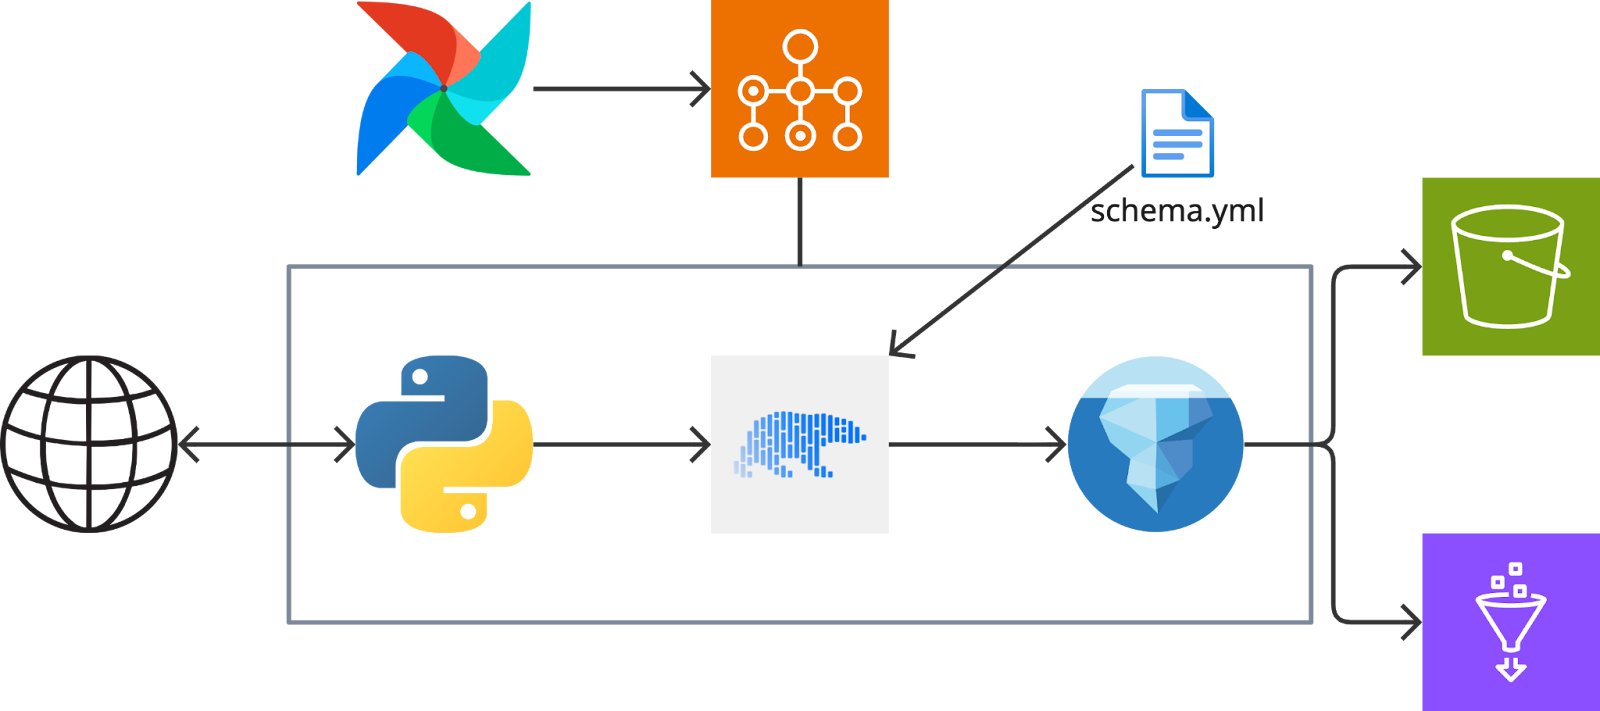
An example of a scheduled batch ingestion pipeline
The main change in how we build our ingestion pipelines now is that they all write to Iceberg tables when they finish running. This gives us built-in functionality for upsert operations, schema evolution, and safe experimentation. We are still only building pipelines for batch processing of structured data but we are betting on Iceberg as a way to future proof for things like streaming data and transactional writes.
We also define a target schema that we use for processing raw data in each pipeline into the shape and format we want to work with during modeling. Setting it at ingestion time lets us propagate all changes downstream from the origin point down to the consumer facing modelled data that we produce. We use polars for the schema normalization as it allows us to do heavy in-memory transformations efficiently and with a simple library. We are not at the inflection point where we need to run massive batch transformation jobs and Spark would be the better choice, so we can keep this all in a single-node Python runtime for now.
Our initial approach was to simply dump as much raw data as we could on S3 and then use Glue Crawlers to discover new tables, partitions and metadata. They were easy to get started with but we soon realized that we wanted more control than they could offer. We began seeing errors and data gaps downstream and traced them to crawlers with faulty schema inference. At first, these were related to nested keys in complex data structures, but then we found some cases where a crawler seemingly randomly decided that a column that had been a string for months now was an integer.
Instead, we pivoted to building complete pipelines that executed raw data imports, normalizations and loading the results as individual steps of contained processes. This immediately improved observability and data consistency.
In addition, spreading the responsibility of creating clean and useful data products for consumers freed up valuable time to build and validate new ingestion pipelines. All in all, our vision of a flexible and efficient data platform has started to take shape, with plenty of room for expanding and adapting on the pieces that we have already shipped.
Federating Access & Centralizing Definitions
To make the most use out of all the new tables made available by us and other data producers, we needed a data catalog component to complement our lakehouse architecture. Glue’s Data Catalog supports connections to all storage locations for other teams’ product domain data as well as a way to federate access to tables across accounts. This was key for us as a centralized data team since we needed a simple way to work with the first-order data products provided by other data producers. As a part of each domain team transitioning into a data producer role, we worked together to configure their respective data catalogs so that they could be shared with others.
The result: every data producer’s catalog, including ours, is available to query in Athena by any employee via a centrally federated data catalog. So, we now have a single place that lets anyone interact with all business data and the relevant metadata. Access can be provisioned by DevOps and audited by Security, which saves our team time that we would otherwise spend on governance work. It’s only the first step on a longer journey of creating a tool agnostic data platform, but it’s already a significant move towards self-serve ad hoc analysis for consumers.
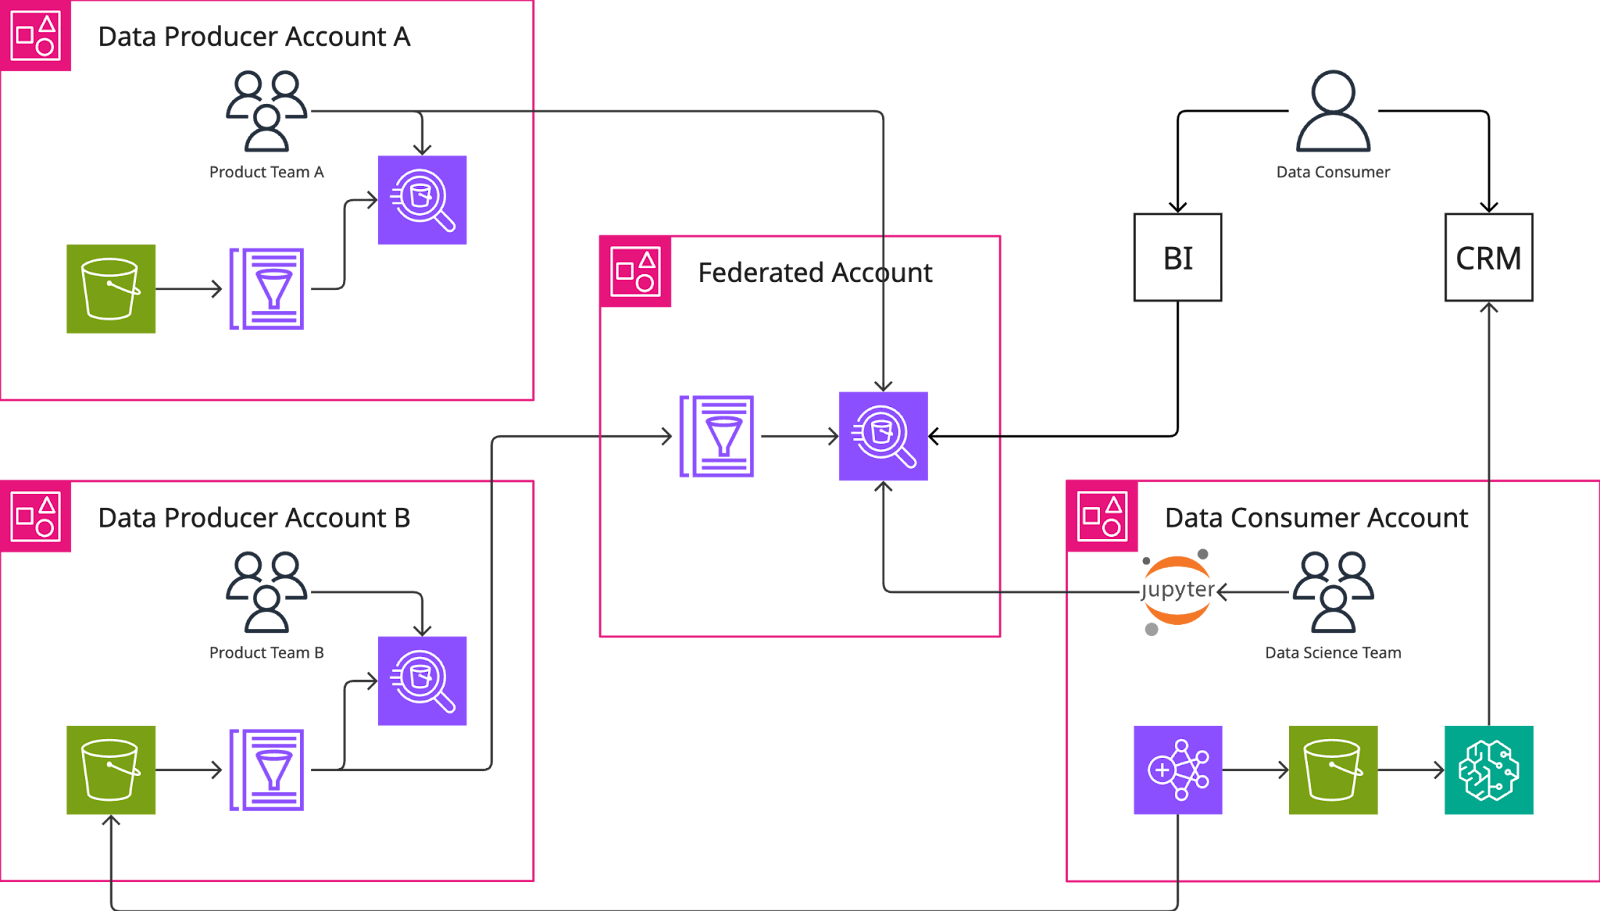
A simplified view of our data federation.
To further democratize business data, our team developed a set of first order data products that sit apart from the rest – we refer to them as core datasets. These are tables that hold global definitions of key metrics and dimensions that we want to be used and interpreted consistently across the entire business. The concepts of a customer, feature, user, invoice and all other business entities along with their attributes are modelled here together with crucial facts such as product usage, user activity and revenue transactions. Thanks to Iceberg, these can now be read from and written concurrently by multiple applications and consumers with no downtime.
The early investment in building our data products on Iceberg should also pay dividends in the long term. Iceberg is gaining popularity in large part thanks to it being query engine agnostic and supporting most modern file formats. It should help us achieve a future proof data platform both in terms of how we develop new data products on top of it as well as choosing new third party tools to integrate with it.
As the complexity of our modeling grows, we also expect to need to optimize our write operations for cost and efficiency further. Using merge and upsert operations will be important and Iceberg is, once again, our key to this working well. Furthermore, an increase in operations means an increase in risk of failure, so the ability to roll back Iceberg tables to a snapshot of its last stable state will ensure the best possible consumer experience. Accidents happen, but we can try our best to be prepared.
New Modelling Practices
Over the last few years, we’ve seen a rise in adoption of cloud data platforms and ETL/ELT tools that make data transformation easier than ever. Consequently, there’s been a surge in the sheer amount of pipelines and tables being built by analysts, data scientists and engineers. In fact, one could make the case that the definition of what counts as a data pipeline has grown to be a lot broader.
 is this a dead meme?
As heavy users of dbt, we had become used to the ease with which we could throw a new set of models at each new challenge without really thinking too deeply about the impact on computational costs. This wasn’t necessarily a huge problem when it came to our end of month billing, but it began to feel like an anti-pattern because of how it affected the ease of use of our data platform and reporting layer. We decided to try getting better at finding the sweet spot for the size of our models and avoid getting too high level (business units) or too granular (asset) moving forward.
Our new approach combines the strengths of building data warehouses bottom-up (dimensional modeling) and capturing attributes based on predictive value (feature engineering). In practice, we still follow a star schema but we have a bias towards denormalizing attributes directly into fact tables if they are queried often. If an attribute's history needs to be easy to track over time, even if it’s slowly-changing, it belongs in a fact table too. Otherwise, we widen an existing dimension table rather than creating new ones and keep our project compact.
In the immediate term, we have halved the amount of dbt models in our project and drastically simplified our semantic layer in Looker. Our daily incremental project runs are 33% shorter than previously and we are still executing them all on Athena without any reserved processing capacity, so there’s no overhead spent on provisioning and managing those kinds of resources for the time being. Having thought two steps ahead before deploying a new model to production we are able to work in a way where we anticipate consumer needs proactively instead of only reacting to feature requests.
In order to scale our data platform sustainably next year, we will maintain our effort to build data products that provide a good level of abstraction for consumers. We believe that this requires us being present in every phase of the lifecycle of our business data and spending even more time in the problem spaces of our end users. A deep understanding of our products will still need to be paired with seeing the big picture of our company but we are moving away from leaning on top-down and waterfall methodology to guide our decisions.
What’s Next?
Although there’s work left to be done, the first phase of building our new data platform focused on:
- Implementing a centralized data platform and catalog on AWS aimed at providing trustworthy data across the company with consistent definitions of core entities and metrics.
- Deploying a Data Mesh inspired architecture, assigning data product ownership to product teams and preparing for a modern lakehouse setup
- Adopting refined data modelling practices to create sustainable, impactful data products for consumers
In the coming year, we intend to shift our attention more to adoption of our data products and iterating on them. This means generating more and shorter value-focused feedback loops with our consumers and spending time close to the core analytics challenges.
We will also explore more tools and technologies to plug into our new data platform with the goal of finding new ways for consumers to interact with the data platform.
Lastly, we will invest in learning what new value we can generate from using AI to read structured and unstructured data.