
As a marketer, you’re under a lot of pressure. You make decisions that can directly impact the company you work for. So, why would you cruise through the decision-making process blind?
You wouldn’t.
Marketing reporting is how you turn chaos into clarity. It’s not just about tracking clicks — it’s about showing marketing’s impact on your wider business goals.
It doesn't matter if you work in an agency, as a marketing data analyst, or are the CMO of an in-house marketing team. At some point, those looking to you for results (clients, managers, stakeholders) will want to know how it is going. And that’s why digital marketing reporting is a top priority.
But where do you start? And how can you avoid the common pitfalls and make sure your reports are not only accurate, but useful to you and your team?
This guide covers all you need to know about digital marketing reporting. We’ll get you set up with a solid marketing reporting strategy, so you’re ready for the boardroom any time.
What is marketing reporting?
Marketing reporting is gathering and analyzing marketing data to create a clear report. The goal is to inform future marketing decisions, strategies and performance. Great digital marketing reports uncover meaningful, actionable insights and inspire action.
Sounds simple enough, but you know that’s not always the case. But with that said, marketing reporting can be a heck of a lot easier and much more effective when you have access to a reporting tool that yields a comprehensive analysis via real-time data visualization.
Who needs to create marketing reports?
Any marketer will benefit from marketing reports, as long as they get them right. With access to data that highlights key marketing metrics, it’s easy to make better decisions that benefit everyone in your company.
Who you create reports for outside your team will depend on your role and dynamic, and on who is most interested in your marketing results. You want your data to be presented in a way that’s easy to understand, showcasing major results upfront, supported by visuals and section headers. Crafting a storytelling narrative from your marketing report is also a great strategy that will help your insights to stick.
Data from Gartner shows nearly 50% of CMOs say their marketing efforts are viewed as an expense rather than a strategic investment. This shows how marketing ROI is not always entirely black-and-white, especially if you’re navigating an incomplete data infrastructure. This is why methods like MMM and incrementality shine (more on that later).
So who’s looking at those marketing reports?
- Digital marketing agencies often send monthly or weekly marketing reports to their clients to help them understand how their advertising campaigns perform. This communication helps build a trusting, transparent partnership — which is how you become a more reputable marketing agency.
- Internal marketing professionals create marketing reports to share with stakeholders and sometimes with C-level executives. The goal often is to protect the team’s marketing budget. CMOs have to demonstrate that their efforts matter, even if the ROI of those efforts is not overly clear.
- Freelance marketers and social media managers create reports for their marketing efforts to share with their clients weekly, bi-weekly, monthly, or ad hoc, depending on how they and their clients like to work.
.png?width=1200&height=549&name=ad%20tips%20(2).png)
Why marketing reporting is a tricky business
In the world of marketing everything you do can be measured — right?
Well. That’s the promise of digital marketing, and you’ve likely heard it all too often. While the results of traditional mass media marketing campaigns were hard to measure, the idea of digital marketing is that, through extensive tracking, we can understand exactly what we yield.
But is that really the case?
Perhaps not. Multi-touch attribution modeling, for instance, is still a challenge for most companies. While this model is the holy grail, it is not without its barriers — which is why many marketing professionals with access to advanced data teams are exploring the possibilities of marketing mix modeling (MMM).
Regardless of your current tactic or analysis technique, one thing is certain: you must organize data meaningfully, focusing on what matters most. By creating insightful marketing reports, you can then make data-driven, informed decisions about how to proceed. Digital marketing reporting can inform future marketing plans and strategies.
This process helps connect the dots, allowing you to examine performance data across your marketing activities. That complex data can be transformed into an easy-to-understand progress report, giving you the bird's-eye view needed to make better decisions. As you learn from past campaigns, you can improve future strategies. You can also better showcase the impact of your efforts on the company’s bottom line, which is music to stakeholders’ ears.
-2.png?width=1200&height=384&name=brief%20quote%20(1)-2.png)
Why is reporting important in digital marketing?
So we know what reporting is, and we know why it’s difficult, but why do we do it? It’s good to know why we’re doing a task before we start — that gives us the confidence to know the effort we’re putting in is worthwhile, and helps us get a focus on what needs to be done. These are five reasons why we at Funnel think it’s a top priority:
- Transforming data into compelling narratives
Reporting gives a valuable insight into the marketing team’s or agency’s activities and performance. With clear data visualizations, marketers can craft better narratives that resonate with clients and stakeholders. - Justifying marketing decisions with confidence
Effective reporting supports decisions to scale, pause, or pivot specific activities, such as targeted campaigns or platform strategies, which means your resources are always allocated appropriately. - Setting the stage for future strategies
Well-prepared reports lay the groundwork for upcoming plans, making it easier to secure funding and align stakeholders with a clear, data-driven direction. - Demonstrating the value of your investment
Marketing reporting highlights the ROI and POAS of advertising efforts, combining multiple KPIs to tell a story that justifies the investment and showcases the impact. (We’ll get to important KPIs and metrics later on, so keep reading.) - Turning reports into powerful presentations
By using data storytelling techniques and impactful visuals, reporting can transform dry metrics into magical, persuasive presentations that captivate stakeholders.
It’s easy to think that the more money a company spends on marketing, the more important reporting becomes. Big dollars = big clout. But it’s just not so. Every marketer’s approach is relative based on the company or client — marketing spend is relative to company size.
A small business, like a local florist, might invest $500 per month on marketing and feel very anxious about it.
They might say, "Is this a good investment? Are we seeing the results already?"
While $500 over a month might not seem like a large amount of money to invest in marketing, for small businesses and emerging entrepreneurs, it can be a serious investment. In that case, marketing reporting is very important to ensure the client understands how their money is being spent, why it is spent in that way and what the results are — even if those results aren’t immediate.
On the other hand, a huge global company spending millions of dollars might only want to see the top line. So you need to be able to create a compelling, minimal summary of your marketing efforts, and use the deep dives only for you and your team.
-1.png?width=1040&height=656&name=Frame%201000002844%20(1)-1.png)
What makes a good digital marketing report?
The reporting process is not as simple as printing off automated documents and handing them out. Although there is plenty of technology that is speeding this process up, you still need to take a hands-on approach. And that means: understanding the best practices and avoiding the pitfalls. So, these are our five pro tips for creating a great, effective digital marketing report.
1. Set clear and relevant objectives
Start by aligning marketing reports with your marketing strategy and business goals. And don’t overlook an important element: focusing on who you are actually writing for. It’s very nice creating a flashy presentation with big numbers, but if it doesn’t mean anything to the person you’re showing it to — it’s all for nothing.
Try to answer these questions before even starting the report:
- Who will read this marketing report?
- What is their role?
- Will more than one person consume this report?
- How much do they know about digital marketing?
- What are the things (KPIs or metrics) they care most about?
- How would they like to receive the report?
- Do they prefer weekly, biweekly, or monthly marketing reports?
Playing a guessing game? It’s often best to actually ask your client these questions. They can tell you if they want to share the report and who might be interested. Ask if they prefer a text-based document or would rather see a presentation, and how familiar they are with marketing jargon and acronyms like CTR or CAC.
And of course, if they aren't very knowledgeable about digital marketing, you might want to include some explanations in your report for the words and phrases you are using.
As soon as you know what your audience wants to see, you can start writing the digital marketing report. Once you get into the groove, you can automate this process and lean on free templates like the ones we have pre-made for you at Funnel.
Knowing what to include in varying types of digital marketing reports can help guide your process, especially as objectives shift and trends evolve. For example, a search engine marketing (SEM) report will differ from a specific campaign report, like a Black Friday campaign report.
2. Collect quality data
You know the saying ‘garbage in, garbage out’? It goes for reporting too. To create reports, you need to collect data. But not just any old data that’s skewed and inaccurate — you want the good stuff. Cleaned, transformed and normalized, ready for your report and analysis.
Marketing software can simplify this process. You might already know about Google Looker Studio, Microsoft Power BI and Tableau — and how to bring it all together with Funnel’s solid data hub as a foundation. With Funnel, you can collect data from over 230 sales and marketing platforms to benefit from a single data hub.
Make sure you check out this guide on the marketing data tools you can’t live without, too.
2. Give it some pizazz with visualizations
Data visualization techniques matter. Color, size and position are three techniques to focus on, helping viewers make sense of the data you present.
You’ll need to invest in a platform that presents consolidated data, showcasing it on a modern, clean dashboard. Once you have the data organized, you can take that information and turn it into visually pleasing charts and graphs. We have a whole blog on creating visualizations here. Get stuck in!
4. Focus on insights and take-aways
So you have great numbers, made with quality data, visualized in an interesting way? Great.
But even good numbers and nice graphs can be misleading or unclear without insights or key take-aways. Make sure you prioritize data inclusivity in your reports, and clarify the insight that each point makes. You could even align that with wider company goals.

5. Keep it simple: one thing at a time
When you have heaps of reliable data and lots of interesting insights, it can be tempting to cram in information into each slide of your report. But this makes it hard to take in and remember. Instead, stick to one point per slide, and choose fewer insights per report, focusing on quality and impact.
Ready to level-up your reporting? Book a demo and see how Funnel can transform your data.
What should a digital marketing report include?
We’ve kept this section short because we already have a guide on this topic. Find it here or read the summary below.
In general, a good digital marketing report should contain the following elements:
- A summary of the marketing activities you have done
- Information about the results of those marketing activities (data)
- An explanation of what those results mean (insights)
- A summary of the next steps you are planning to take

Always remember who you’re writing for. If the person reading it doesn't have much marketing knowledge, include more information about what acronyms mean and why they’re important. This way, they feel included and will understand the impact of your findings.
Another way to better cater for your audience is to add or take away certain details. The CEO or CMO will probably have specific questions about the marketing campaigns of the past quarter, but they won’t be the same as the ones your direct colleagues have.
Combining reports
But this doesn’t mean you need to create a million different marketing reports for all your marketing strategies. Just see if you can combine two or three reports together — like your SEO report and a report about your PPC campaigns. If you’re reporting to a general digital marketing manager, they will want to know how both campaigns are performing anyway.
That said, if you do have different contact persons or stakeholders for SEO and paid channels, creating separate, custom reports about the two topics is probably a smart choice.
Choosing the right KPIs for your goals
It’s time to think about which marketing metrics your report should cover. ‘KPI’ stands for key performance indicator, and they’re the metrics business use to measure success.
Which KPIs you choose depends a lot on the scope of your work and your goals. If you focus on email marketing, it’s not going to be necessary to include social media metrics in your report (unless your campaigns evolve). So, make sure that both you (and whoever reads the marketing report) have a clear understanding of the goals of your project.
The KPI tree
The best way to think about marketing efforts (and metrics) is to tie them to overall company goals. This can be done by creating a KPI tree.
Not all metrics carry the same weight — and not every stakeholder cares about the same things. The KPI tree can help you work out who wants to know about what by mapping the various metrics together with the different focuses of the company. It can help you to structure your reporting, because it mirrors how decisions are made:
- Top-line results → These are your north star business outcomes your company cares about, things like revenue growth, profit, or LTV.
- Business KPIs → High-level success metrics that indicate whether marketing is driving impact (e.g. CAC, ROAS, pipeline contribution).
- Marketing KPIs → Core metrics for each channel or function, like POAS, MER, conversions, or engagement rates.
- Project KPIs → Milestone metrics for big initiatives — campaign launches, web rebuilds, lead gen programs, etc.
- Campaign KPIs → Tactical dials that guide optimization, such as CTR, CPC, impressions, and email open rates.
Aligning your report to this structure helps every stakeholder — from analysts to execs — see how day-to-day efforts roll up into big-picture goals.
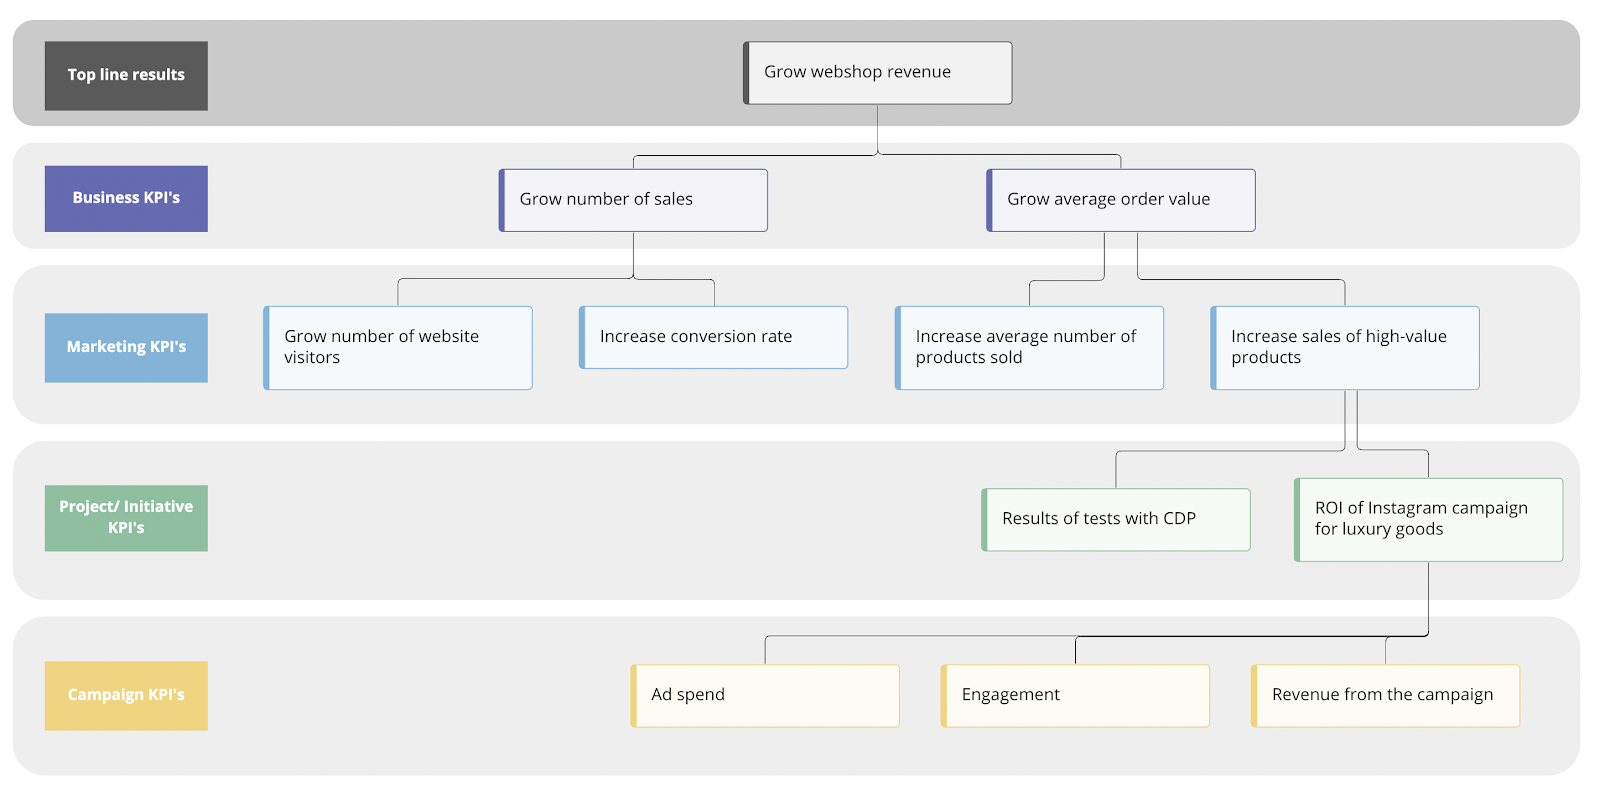
In the above example, you can see specific campaign metrics in yellow. But by creating the KPI tree, it becomes clear how the campaign ties into the business's core marketing strategy. Having this in place might help people with less marketing knowledge understand how your marketing work impacts the rest of the company.
The difference between KPIs and goals
Key performance indicators (or KPIs) are the specific metrics you choose to track in order to measure the performance of your marketing efforts. But not every metric is a KPI — only the ones that really matter to your goals are considered “key”.
As an example, let’s say I’m running a paid search campaign. I might choose these KPIs to measure my success:
- Profit on ad spend (POAS)
- Marketing efficiency ratio (MER)
- Engagements or clicks
- Average click-through rate (CTR)
- Average cost per click (CPC)
- Ad spend
.png?width=688&height=459&name=Tag%20management%20(2).png)
These metrics help me monitor how the campaign is doing. But on their own, they don’t describe our wider company or team goals. They’re simply measurement tools. Goals define what we want to achieve with each KPI.
Using the list above, my goals might be something like this:
- For POAS, aim for of a profit target from 120% to 150%
- Generate 700 clicks to the website per week
- Keep average CTR above 1%
- Keep the average CPC between
- Don't spend more than the budget
Tip: More isn’t always better! Ask yourself: does the client really need to know the bounce rate on every single landing page? Probably not. Too many metrics can dilute the message and distract you from what’s important. That’s why it’s vital to focus on the KPIs that support your goals. Keep it simple, keep it actionable.
Which KPIs and metrics should I measure in my marketing report?
Ok, so we looked at an example of one paid media campaign, but what other sorts of marketing KPIs and metrics could we include in a report? Well, there’s a whole load to choose from. So just remember when you’re choosing, it’s about “key” metrics, the ones that support your goals, not absolutely everything possible.
Let's dive in.
1. Traffic and visibility metrics
These tell you how many people are discovering your brand and where they’re coming from. These are things like:
- Website sessions
- Unique visitors
- Pageviews per session
- Bounce rate
- Traffic by source/channel (organic, paid, direct, referral, social, email)
- Top landing pages
- Branded vs. non-branded search traffic
2. Engagement metrics
These ones show you how your audience interacts with your content and touchpoints.
- Time on page
- Scroll depth
- Pages per session
- Social shares
- Comments and reactions (social media or blog)
- Email open and click-through rates
- Video view duration
3. Conversion metrics
The core of performance marketing is often seen as conversion metrics. These show how well you’re turning interest into action.
- Conversion rate (by channel and campaign)
- Cost per acquisition (CPA)
- Lead form submissions
- Sales-qualified leads (SQLs)
- Micro-conversions (e.g. email signups, downloads)
- Shopping cart abandonment rate
Also read: What is performance marketing?
4. Revenue and ROI metrics
These metrics let you link your marketing activity directly to the wider business impact. (Great for impressing your head honchos!)
- Return on ad spend (ROAS)
- Marketing-sourced revenue
- Customer acquisition cost (CAC)
- Customer lifetime value (LTV)
- Revenue per user (RPU)
- Pipeline attribution (first-touch, last-touch, multi-touch)
5. Paid media performance
If you’re running paid ads, then these metrics will help you optimize to best performing campaigns and justify spend.
- Impressions
- Click-through rate (CTR)
- Cost per click (CPC)
- Quality score (Google Ads)
- Frequency (social ads)
- CPM (cost per thousand impressions)
6. SEO and organic performance
SEO and organic metrics will let you track your long-term brand visibility and discoverability.
- Keyword rankings
- Organic impressions and clicks (from Google Search Console)
- Backlink growth
- Domain authority
- Click-through rate on SERPs
7. Email marketing metrics
For email marketing campaigns, these metrics measure how your audience responds.
- Open rate
- Click-through rate (CTR)
- Unsubscribe rate
- Bounce rate
- Conversion rate from email
- Email list growth
8. Brand health metrics
Brand health metrics are a bit different to the others, but these are especially useful for reporting on awareness campaigns.
- Brand recall or awareness surveys
- Share of voice (organic and paid)
- Brand mentions and sentiment (social listening)
- Direct traffic (as a proxy for brand strength)
9. Campaign-specific
Now remember – not all metrics are key. So you need to create your report based on the campaign objective and wider goals. That could look like:
- Goal completions (e.g. webinar signups, product trials)
- Influencer reach and engagement
- UTM campaign performance
- Multi-touch attribution models
What about marketing attribution?
If you want to report on the success of your campaigns, you need a way to determine which campaigns lead to which results. This objective is where attribution comes in — but it's not the simplest of tasks.
Because it's an important and complex topic, we wrote a separate blog post about it. You can read that here: The digital marketing attribution problem.
Benchmarks and seasonality
Now that you have understood who’s reading the report, which KPIs and goals to report on, and how that relates to the overall business goals, it is finally time to start creating your report. Let’s do a monthly report as an example (because everyone loves a monthly!).
Say you work at an agency and have a B2B company as a client. Your company does both SEO and paid search. In your report, you will want to report on these marketing channels and KPIs:
Search engine optimization (SEO)
- Number of sessions (organic search) per month
- Number of leads from organic traffic
- Total website traffic
Paid search
- Average cost per lead
- Number of leads from paid search
If you just share the numbers for the past month, your client will have difficulty understanding the true nature of the campaign’s performance. They’re just numbers — with nothing to compare it to. Are the digital marketing efforts performing as expected, or not? Is this normal or out of the ordinary?
Yup, you guessed it. It is hard to answer those questions without data to compare the numbers with. We need context to get value and insights from the data.
3 ways to compare key metrics
The best way to present the data is to compare it with benchmarks. A typical marketing report compares the marketing results with at least one of these benchmarks:
- The previous period (month-on-month or week-on-week). This is valuable if you often change the tactics of the campaigns.
- The same period, a year earlier (year-on-year). Use the YoY comparison if seasonality plays a big role in your business.
- The goal or target set for the period. For KPIs with a clear goal, always compare performance with that goal.
When creating marketing reports, we suggest using one or more of these benchmarks to compare the results. This will help you and your client or stakeholders to understand current performance and go from data to actionable insights.
A good way to display this is by adding the percent change next to the value. It can look like this:
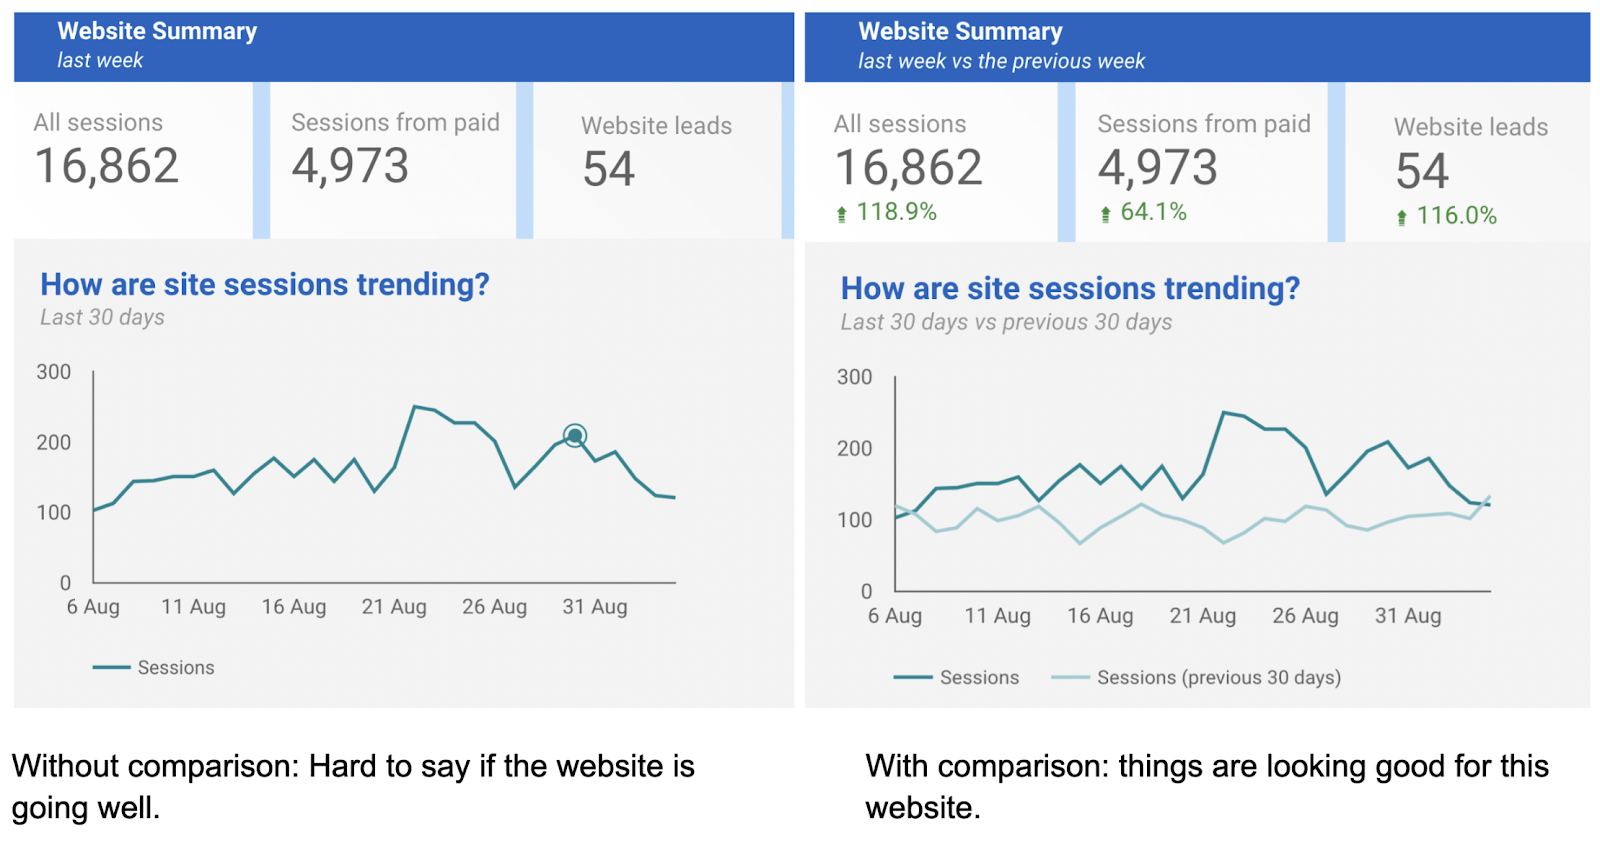
There are even more ways to add context to data than the three mentioned above. This blog post, Six Ways to Put Your Numbers in Context, is a good starting point.
A note on seasonality
Seasonality has become a bit of a joke in marketing teams. Campaign didn’t work out as planned? Must be seasonality. Dip in conversions? Ah, that’s seasonality. Higher cost per acquisition? Seasonality of course! But jokes aside, seasonality is a real thing, that really does affect results. But first: what even is seasonality?
Seasonality in marketing and sales is the predictable effect of seasons or commercial holidays in a year. This is different for every business. For instance, an ice cream company will expect to sell more ice cream in the summer than during the winter months. At the same time, a B2B company might expect lower leads and sales during summer because its prospects will be out of the office for summer vacation.
When you start working for a new company or onboard a new client, you can ask if there is any seasonality in their market. You can also look at all the data available in Google Analytics or their advertising platforms to see patterns in earlier years. This is especially important when creating forecasts or budget planning.
Types of marketing reports
Types of marketing report
Your reporting strategy will alter based on the channels you or your clients target.
1. Performance report
What it covers: Channel-specific or campaign-specific metrics (e.g. ROAS, CPC, impressions, CTR)
Who it’s for: Channel managers, paid media teams, performance marketers
Use it when: You need a detailed view of how your ads, posts, or campaigns are performing. These reports are often used to make tactical decisions — should we shift budget from one channel to another? Pause a poor-performing ad group? The report will help you make your decision.
Tip: Use a pre-built Funnel Performance Marketing dashboard to track your numbers.

2. Executive or leadership reports
What it covers: High-level KPIs, budget pacing, business impact (e.g. MER, pipeline influence, customer acquisition cost)
Who it’s for: CMOs, marketing leadership, finance stakeholders
Use it when: You’re reporting monthly or quarterly progress and need to tie the marketing performance to business outcomes. These reports are less about granular optimization and more about strategic alignment.
Tip: Include trend lines, comparisons to goals, and summaries in plain English. Avoid raw data dumps.
3. Channel overview reports
What it covers: A summary of all active channels — typically including paid search, paid social, organic, email, affiliates, etc.
Who it’s for: Heads of marketing, growth teams, cross-functional managers
Use it when: You want to understand how all your marketing efforts are working together. This type of report is great for spotting imbalances (e.g. too much budget in low-performing channels) or attribution blind spots.
Tip: Use our pre-made dashboard templates for social media channels, like this one for Facebook Ads.

What it covers: A post-mortem of a specific campaign or initiative, including results, lessons learned, and next steps
Who it’s for: Internal teams, external partners, stakeholders invested in the campaign
Use it when: You’ve wrapped up a launch, seasonal push, or experiment and want to document outcomes. It’s great for learning and improving future efforts.
Tip: Go beyond the numbers. What surprised you? What would you do differently? What worked better than expected?
5. Real-time dashboards
What it covers: Live or frequently updated metrics from your marketing platforms
Who it’s for: Practitioners, analysts, or anyone who needs to monitor performance daily or weekly
Use it when: You want to stay agile and make rapid decisions. Dashboards are great for catching anomalies early (like a sudden spike in CPC) and staying on top of fast-moving spend.
Tip: Just because it’s live doesn’t mean it has to be busy. Prioritize clarity over complexity.
Related reading:
🙅♀️ Using multi-channel attribution for cross-channel marketing
💃 How the triangulation tango reignites marketing measurement
Ways to present your marketing report
There are many types of marketing reports, allowing you to highlight the most important metrics and results. But before you send your report off, let's get into some other aspects of reporting that are important to discuss: ways to present your marketing report.
1. Dashboard
The easiest way might be to create a Google Data Studio dashboard. If you set it up correctly, it will automatically show the right numbers all the time — no preparation and spreadsheet-building required. And as a bonus, comparing data with a year-on-year or other benchmark is nice and easy.
However, just shooting a link to an automated report might not be insightful enough for whoever is reading it — particularly if they’re not marketing people, they might not be able to fully understand all the data. You have to tackle this step on a case-to-case basis.
And yes, AI will help crunch numbers and present them faster than ever before, but data fluency is still required to make sense of it all.
2. PDF
If you don’t want to share live numbers, you can use your dashboard to collect the data and then paste it into a text document or presentation. Then, you can write the conclusion or insights next to each screenshot.
This is a great way to ensure that your marketing reports provide relevant insights without taking up too much of your time. Just remember to download your document as a PDF and share it with your client or stakeholder.
While a neat document in PDF format is the best option for some people, other situations might require a different approach.
Imagine you work for a client who wants to know only some key performance indicators and doesn't want to spend a lot of time reading the report. In this case, you might choose to email them just the most important numbers once a week. But be ready to deep-dive with them if they want some more information!
4. Meetings (and a presentation)
Lastly, a meeting. Your weekly update emails may be sufficient for a while, but once every quarter, you may also want to present the results and discuss them in person. This also allows you to propose new initiatives or ask for a higher marketing campaign budget if that seems appropriate. This is great for stakeholders, but it’s also a great opportunity for you too, to really get on top of the numbers and set yourself some new goals.
The best tools for marketing reporting
With so many marketing reporting tools out there, choosing the right marketing reporting software can feel overwhelming. The key is to think in layers. Each tool solves a specific piece of the reporting puzzle.
Here’s a breakdown to guide your decision:
1. SEO and web analytics tools
You’ll want to look for tools that go beyond vanity metrics to show what’s really driving traffic and engagement. Vanity metrics are things that look impressive on the surface (impressions up 40%!) but actually are irrelevant or distracting when looking at progress towards your wider goals (impressions doesn’t mean people clicked or that it even ranked in relevant searches!).
So, that’s why we recommend looking for software that connects search performance with on-site behavior, so you can tie keyword gains to real business outcomes.
- Google Analytics 4 (GA4) – A must-have for tracking user behavior, conversions, and traffic sources.
- Google Search Console – Essential for organic search performance and indexing insights.
- Ahrefs / SEMrush – For deep dives into keywords, backlinks, and competitive SEO insights.
- Matomo – An open-source alternative to GA4 with more control over data privacy.
2. Business intelligence (BI)
For deeper insights, BI capabilities help you slice, dice, and forecast data in ways static reports can’t. You should look for tools that allow non-technical users to explore data on their own, without waiting on analysts or SQL queries. Otherwise, you’re just creating a new bottleneck to get frustrated with!
- Looker – Powerful BI tool that lets you build custom data models and explore them with ease.
- Tableau – Ideal for organizations that need rich visualizations and data storytelling.
- Power BI – Microsoft’s BI platform that integrates well with Excel and Office 365 workflows.
- Mode – Combines SQL, Python, and visual dashboards — great for data teams and marketers working together.
3. Data integration
Data integration is going to be a super important one. This is the foundation for your marketing reporting. This software should unify data from all your key marketing channels (paid, organic, email, social, etc) into one consistent structure. That way, you’re not stuck stitching together exports or reconciling inconsistent metrics.
- Funnel – Of course, we love Funnel! It’s purpose-built for marketers, it automates data collection from 500+ marketing platforms and organizes it into analysis-ready form.
- Zapier / Make (Integromat) – These are low-code tools for light automation and connecting apps, great for filling integration gaps.
- Custom APIs and scripts – These are best for teams with dev resources. It takes a little extra time, but this option offers the ultimate flexibility.
4. Visualization and dashboards
We’ve written so much about data visualization (just search in our blog!), because we think it’s so important. There’s so much power in making your data digestible, beautiful, and actionable. So make sure you choose tools that let you create intuitive, interactive dashboards your team can use and understand. These are our favourites:
- Looker Studio (formerly Google Data Studio) – Free, flexible, and well integrated with Google’s ecosystem.
- Databox – Mobile-friendly dashboards with goal tracking and KPI alerts.
- Klipfolio – Prebuilt dashboards and widgets designed with marketers in mind.
- Notion – While not a visualization tool per se, it’s great for embedding dashboards alongside commentary.
- Funnel — It’s us again! Yes, we also have built-in dashboards and templates that you can use right away with all your super fresh data.
5. Sharing and collaboration
Sometimes it can feel scary to share your numbers. We get it. But a great report (scrap that, any report) is pointless if no one sees it. That’s why you should prioritize platforms that make it easy to share live dashboards, schedule automated updates, or comment and collaborate directly in context. Marketing data shouldn’t live in a silo, it should be shared!
- Slack – Share report snapshots or automate alerts directly into your team channels.
- Notion / Confluence – Create centralized reporting hubs for teams, combining dashboards with narrative context.
- Email automation tools (like Mailchimp, Customer.io, or built-in platform schedulers) – Deliver regular reporting updates to stakeholders.
- Loom – Record quick walkthroughs of dashboards for async collaboration.
Think modular. The best setup often combines tools that play well together rather than relying on a one-size-fits-all platform. Focus on building a stack that connects your data, delivers clarity, and supports fast decisions.
In terms of templates, there are loads of great free dashboard templates you can add to your reporting to make it more interesting. Check out our pre-made dashboards, or sign in to Funnel to start building your own.
What to avoid in your marketing reporting
We’ve talked a lot about what to include, but what should you not include in your reports? We’ve narrowed it down to three main pitfalls.
Too much jargon
Sure, sometimes it’s quicker and easier to say ‘CAC’ for customer acquisition costs, or ‘YOY’ for year on year – but if your recipient doesn’t understand or use those acronyms, it all starts to look like meaningless waffle. This is also relevant if you’re using shortenings for things like LinkedIn or Facebook Ads (something like ‘LK’ or ‘FB’). For the uninitiated, it can be frustrating to see a wall of letters that don’t mean anything to them.
If that’s all done and dusted, think about how you talk and present your report. Don’t use boring, washed-out phrases like “in today’s changing landscape” – tell a real story and be genuine.
Too many KPIs
We mentioned this already, but the ideal number of KPIs is 3-5 per goal, area or channel. Cramming hundreds of metrics into the same report is tempting – the more the better, right? Well… not really. The clearer the better. And clearer often means trimming away every little bit of excess so you’re left with the most juicy, important findings. So make your KPI tree, find the most important metrics that resonate through the business and to the people you’re talking to, and keep the rest to yourself.
Vanity metrics
It might be tempting to include some really flashy metrics that you know aren’t necessarily reflecting meaningful contributions to the business goals — but you just want to impress. Vanity metrics might look good and make you feel like things are going well, but they can be misleading and lack context. Instead of these, go for actionable, outcome-aligned metrics. It’s better to report the not-so-good numbers and explain what happened and what you learned than pretend everything’s fine with some meaningless numbers. Remember — we want colleagues to trust our reports, and so we have to make them with integrity.
Key takeaways
1. Marketing reporting is a strategic necessity, not just a task
Whether you’re an agency, freelancer, or in-house marketer, reporting is how you prove value, secure budgets, and build trust. It turns marketing into a measurable investment instead of a perceived cost.
2. Effective reporting connects data to decisions
It’s not just about collecting metrics—it’s about turning complex performance data into actionable insights. Good reports help marketers refine strategy, optimize spend, and align with company goals.
3. Clarity, context, and customization matter
To be impactful, reports need to be tailored to their audience. That means selecting the right KPIs, explaining jargon, providing benchmarks for context, and choosing formats (dashboard, PDF, email, presentation) that suit stakeholder preferences.
4. The right tools and best practices make reporting easier and smarter
Modern marketing reporting combines SEO, BI, data integration, visualization, and sharing tools to streamline the process. Using the right tech stack—and following reporting best practices like setting clear objectives, focusing on insights, and simplifying visuals—helps you scale reporting without losing quality.
Want to learn more? Check out some of these successful reporting case studies to see how you can take advantage of Funnel and more streamlined reporting:
- Trivago went from 30% marketing reporting coverage to 100% with Funnel
- NP Digital achieves digital reporting harmony thanks to Funnel’s marketing data hub
- Funnel enables Sparro’s team to generate an additional $150,000 in revenue
Happy reporting!