
Marketing reporting automation can be a game changer for digital marketers. It can totally change your perspective on what’s possible in your role, reduce time spent on tedious tasks and allow you to provide more value to your organization. But what is marketing reporting automation, what are its benefits, and how can you start automating your reports today?
So, let’s start off by defining exactly what we’re talking about. The good news is that this one is pretty self-explanatory. Marketing reporting automation is the act of creating a workflow that automatically generates marketing reports on your behalf, without any manual work.
.png?width=1200&height=460&name=automation%20(1).png)
What is automated reporting?
Workflow of automated marketing reports
Of course, there are multiple steps of creating digital marketing reports, and you can automate each step. Some companies are able to create one workflow that contains all the steps, which might look something like this:
- Collect relevant marketing data from one or more connected data sources
- Clean, transform and blend data as needed
- Push the blended data to a visualization tool
- Automatically create reports to be exported on a regular interval
- Schedule automated reports to be sent to clients or stakeholders
As you may be able to tell, each of these 5 parts of a basic workflow could take a long time to perform manually. Even by automating the connection between each point for the flow, you can imagine that you could save a lot of time and energy. Think, then, about how much time you could save by automating the entire process.
What are the benefits of marketing reporting automation?
Faster insights and data-driven decision making
Time savings is one of the biggest benefits we see for automating your marketing reports. It can literally mean hundreds of hours in monthly time savings — as our customer Power Digital can attest.
While they are a digital-first marketing agency, their data collection and management system wasn’t effective and required a lot of manual manipulation to get their reports functioning properly. However, with the help of Funnel, they were able to securely automate the entire reporting process.
And that time savings has allowed them to enjoy a high-level benefit of marketing report automation: the ability to grow their data team and capabilities. Over the past few years, they’ve been able to grow that team from 2 to 12 people.
This blogpost is a part of our ongoing series about digital marketing reporting. Discover more.
Data empowerment and innovation
Beyond expanding the size of your data team, it can also open up new possibilities and revenue streams for your business.
Our client Arm Candy experienced such a journey. Once they were able to implement marketing reporting automation, their analysts suddenly had a lot of “free time” on their hands. That time and energy now goes into providing higher level insights to the clients, which leads to better marketing strategies and stronger client relationships.
The cascading effect of smoother operations and client management has allowed them to begin building a proprietary media planning tool that will generate additional revenue for the agency.
As you can see, just by saving time, report automation can have ever-expanding ripple effects that have the capacity to transform and grow your business.
Greater accuracy and collaboration
Removing the chances for human error means fewer mistakes in your data. But using standardized formats and metrics; plus having easy access across teams also leads to more collaboration and alignment. Working together in this way offers teams a foundation for advancing their data expertise and analysis – which ultimately leads to better strategic decisions, growth and ROI.
.png?width=717&height=339&name=autom%20bene%20(2).png)
Benefits of using an automated reporting tool.
How do you start automating your marketing reporting?
With such enticing potential benefits, you may want to already jump head first into marketing reporting automation. The good news is that it may be easier than you think.
1. Start with a tool you like to work with
Let’s start with a simple tool like Looker Studio (previously called Google Data Studio). As we’ve covered previously, this tool is a great option for those just getting started with data visualization and marketing reporting. To get started, you’ll need to log into the platform, connect the data source you want to report on and confirm the connection.
2. Use a template (or start from scratch)
From there, it’s time to set up the report structure. You can either choose one of their templates, one of our templates, or create a new report from scratch. With the report design selected, you’ll need to ensure that your data connection is then added to the report. You may need to configure a few options (i.e. confirming which tab in a Google Sheet to pull data from), but that will depend on your specific needs.
3. Add relevant data
Next, you’ll need to create and add visualizations to the report. In Looker Studio, this can be done in a few clicks. Don’t forget to confirm date ranges for any time-related metrics.
Some ideas of data to add:
- Google Analytics data about website usage
- Google Search Console data
- Data from social media platforms
- Marketing data from advertising channels, like Instagram / Facebook, Google Ads, or LinkedIn. (You can use Funnel to add Instagram advertising data to your report)
Make sure to not only add tables, but also add data visualizations to the report.
Just like that, we have created a report in Looker Studio. One of the benefits of your new report is that you can schedule automatic email delivery of the report to your key stakeholders with Looker Studio Automation.
4. Automate email delivery
When logged in with editor access to your report, you just need to hit the “Share” button in the upper left corner. From here, you can enter your recipients email addresses, a subject line, and any sort of message you would like to include. Next, you’ll need to enter the data and time that you want the report to be sent out. For instance, you could schedule the report to be sent out every Monday at 10:00.
Step 1: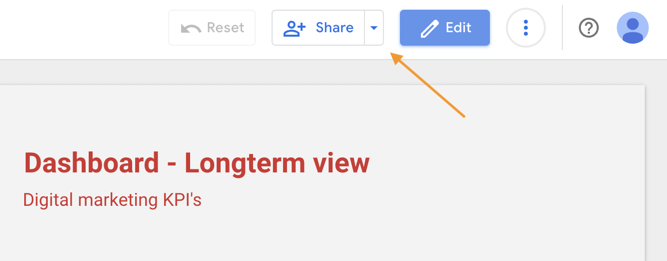
Step 2: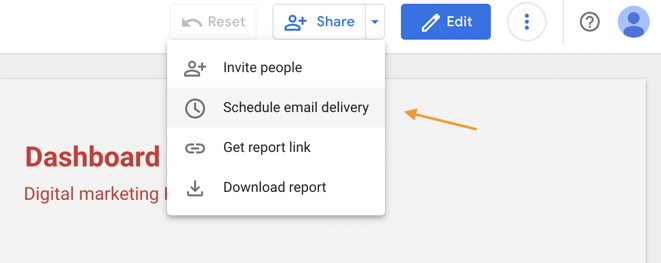
Step 3: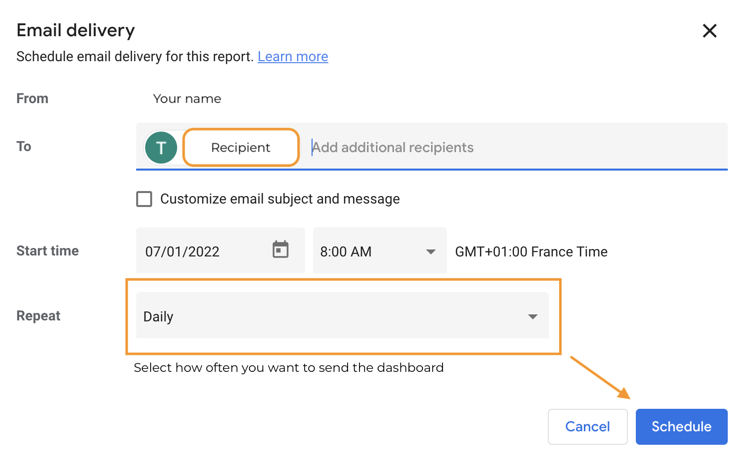
Tools to get started with marketing reporting automation
There’s no shortage of marketing reporting software designed to simplify and automate your work. Like with all things, some will suit your set up, while others won't be a great fit. The important thing is to find robust, reliable tools that support your marketing efforts rather than adding more jobs on your to-do list. Here are a few that we think are worth exploring:
-
Looker Studio (formerly Google Data Studio)
Great marketing reporting tool from beginner to advanced. Free, flexible, and integrates with Google tools. Best for single-source data and early-stage automation.
-
Funnel
Purpose-built for marketers who need to unify data across platforms. Automatically collects, transforms, and connects your marketing data to visualization tools like Looker, Power BI, or Tableau. Bonus: no SQL required. Of course, we think it's a must for digital marketing!
-
Power BI / Tableau
Enterprise-grade visualization tools. Ideal for advanced reporting and data teams, especially when paired with a data platform like Funnel.
-
Zapier or Make (Integromat)
These automation platforms help connect tools that don’t naturally integrate—but require more hands-on configuration.
🧠 Pro tip: Most teams use a combination of tools—like Funnel for data collection, Looker Studio for complex visualization, and a scheduling feature to deliver reports.
Key takeaways
Ready to get see how automated marketing reports can improve your digital marketing? Nice! Here's a quick summary of what we covered in this blog.
-
What it is: Marketing reporting automation is the process of setting up workflows that automatically collect, prepare, and share performance reports—no manual work required.
-
How it works: A typical workflow includes collecting data, cleaning and transforming it, sending it to a visualization tool, and scheduling delivery.
-
⏱️ Save time: Automate hours of tedious reporting tasks.
-
📈 Get faster insights: Enable quicker, data-informed decisions.
-
🤝 Improve accuracy and collaboration: Standardized data reduces errors and brings teams into alignment.
-
🚀 Fuel innovation: Free up bandwidth for deeper analysis and smarter strategies.
-
📊 Know your key metrics: Focus on high-impact data like ad spend, website conversions, and ROI. Automating these ensures consistency and speeds up decision-making.
-
Why it matters:
-
Real-world impact: Agencies like Power Digital and Arm Candy have used reporting automation to scale data teams, improve client strategy, and even create new revenue streams.
-
How to get started: Begin with a simple tool like Looker Studio and gradually build more advanced workflows with Funnel to automate across platforms.
Our conclusion about automated reporting
It’s important to keep in mind that while it is a simple way to implement marketing reporting automation, Google Data Studio does have its limitations (it’s free after all). For instance, it can only fetch data from a single source at a time. If you have data across multiple platforms as most digital marketers do, you’ll need to either collect it in a Google Sheet (the more manual option) or use a solution like Funnel to collect and blend everything together for even greater automation.
Also, it might not be wise to fully automate everything. The data in itself is valuable, but more valuable insights can be found by analyzing, comparing, and in depth analytics. Try to find a way to use automated marketing reports in combination with your own expert eye.
To discover which data sources we can help you connect to and blend, check out our ever-expanding list of data connectors.
Ready for more? Try these:
What to include in your digital marketing report
The best client reporting tools