
What is a KPI?: Key performance indicators (KPIs) are metrics that track progress toward an objective or goal. KPIs help you understand what's working and what's not, so you can hit your targets and stay on track.
Research from Google shows that 95% of leading marketers agree that marketing analytics KPIs must be linked to broader business goals to truly matter. While each team must track the KPIs and metrics that paint a picture of their efforts, everyone should be mindful of how one another's KPIs influence the other groups. The entire organization needs to be (and stay) on the same page.
Here's what you need to know about KPIs, how they're used in different departments, and why, sometimes, less is more. When you opt for a smaller number of manageable key performance indicators for each of your strategic goals, the more likely it is you'll be able to make critical adjustments and maintain an aligned workforce. Let's jump in. -1.png?width=717&height=358&name=whta%20are%20KPIs%20(1)-1.png)
What is a KPI?
KPI stands for "key performance indicator", and are targets you use to track progress. These insights show you what's working and what's not. KPIs are often called "metrics", but these two things are slightly different.
- A KPI tells us the things that will make the most impact on the business. KPIs are a benchmark for ensuring teams stay focused on supporting the business strategy. A typical KPI might be Sales Qualified Leads (SQLs).
- A metric is a way to measure performance of the other activities you're doing to support your main KPIs. Metrics still impact business strategy, but not in the same way that KPIs do. Metrics might be site visits or video plays.
As a marketer, you know the role key performance indicators (KPIs) play in your everyday operations. While KPIs like customer lifetime value and digital marketing ROI are commonly tossed around among marketing teams, other departments may focus on more team-specific KPIs. Not all teams focus on the same KPIs. For example, your finance team may track operational efficiency while marketing may aim for a more optimal cost per lead (CPL).
These varying KPIs help drive an organization's core objectives, ensuring it works like a well-oiled machine. So, you'll need to understand your business goals and top priorities first. From there, you decide which KPIs best serve those objectives.
So, KPIs matter whether you're in accounting or sales — and they may overlap across departments. When they do, they provide opportunities to share insights for more optimized data-driven decisions and performance. The key is to focus on the right KPIs — those that align with your strategic goals.
The problem is that many organizations track KPIs to help managers keep score and meet compliance regulations. These organizations aren't using KPIs to their full potential. Experts at MIT advocate for smarter KPIs, encouraging businesses to explore the opportunities surrounding machine learning and predictive algorithms. These advances can help turn your KPIs into something that guides strategy and carves out a competitive edge.
Recap: what's the difference between a KPI and a metric?
KPIs are the metrics that matter most to business outcomes.
- KPI = tied directly to strategic business goals (e.g. revenue growth, SQLs).
- Metric = useful data points, but not always strategy-critical (e.g. page visits, video plays).
.png?width=1200&height=703&name=kpis%20(1).png)
Why are KPIs important?
- Better decisions: Good KPIs help businesses focus on the targets that will have the biggest impact.
- Resource prioritizations: It’s easier to allocate spend resources more efficiently with KPIs in focus.
- Team focus: It’s clear how to add value to the business, and teams understand their role in contributing to that.
- Increased awareness: KPIs help teams understand risk factors and financial health.
Take a page out of Slack's book (Slack case study)
Slack is a great example of a company that better aligned its marketing and sales KPIs with its overall business strategy. The collaboration software firm set three top-line KPIs — accelerate customer growth, increase general brand awareness, and develop a maturing sales pipeline. By prioritizing these three KPIs, business units know how to best support each other. Slack also understands how to feed the key performance indicators with the right data sources and utilizes them to make business decisions.
For example, marketing has insight into what data the sales team needs to convert free Slack users into paid ones. Additionally, teams have access to real-time data, enabling them to make faster decisions, which increases their agility. Ensuring that the right data is connected to the right KPI is crucial, and Slack seems to have mastered it.
Diving deeper into the different types of KPIs
Key performance indicators come in all forms, and they determine the metrics you measure. Remember, all KPIs are metrics. However, not all metrics are KPIs. The link between the following three types of KPIs is necessary for your ongoing success.
Strategic KPIs
In most cases, strategic KPIs are the most high-level type. Although these KPIs may provide little information outside of a bigger-picture snapshot, like how the company is doing, executives commonly leverage these KPIs.
Examples include:
- Return on investment (ROI)
- Profit margin
- Total company revenue
Operational KPIs
Operational KPIs provide nearly real-time feedback about a business, providing insight into how core operations function. Again, the KPIs you choose will depend on the department. Marketers may focus on return on advertising spend (ROAS) and cost per acquisition (CPA), product owners might want to measure customer satisfaction scores, whereas HR KPIs may focus on absenteeism and employee turnover rates.
Functional KPIs
Functional KPIs relate to specific departments or functions within the organization. These KPIs can be strategic or operational. However, they provide the greatest value to a specific group of users. For example, marketing KPIs may include click-through rates for an email campaign, while sales KPIs may focus on the number of new vendors they enter into their accounting software each quarter.

Real-world examples of KPIs
KPIs look different for varying departments and teams. The following examples showcase how specific KPIs can drive the goals of a single unit while relating to the bigger picture. Whether you're in finance or marketing, the key is choosing the right KPIs — you then need data sources that feed into those KPIs.
Financial KPIs
As you may expect, KPIs in finance focus on varying financial metrics. Financial KPIs are crucial for CFOs, analysts, and stakeholders to gauge a company's financial health. They provide insights into the company's profitability, liquidity, and economic structure, helping managers make informed investment and operational decisions.
If you're in finance, consider the following KPIs.
- Net profit margin: The percentage of revenue left once you deduct expenses from sales.
- Gross profit margin: The percentage of revenue that remains after you deduct the cost of goods sold.
- Operating profit margin: The percentage of revenue left over once you deduct operating expenses and cost of goods sold.
- Return on assets (ROA): A measurement of your company's ability to earn a profit from its assets.
- Return on equity (ROE): A measurement of your company's profitability, which reveals how much profit a company generates with the money shareholders have invested.
- Current ratio: A measurement of your company's ability to pay short-term obligations.
- Debt-to-equity ratio: A measurement focusing on the proportion of shareholders' equity and the debt used to finance the company's assets.
Business KPIs (also known as operations KPIs)
Business KPIs are essential for managers, executives, and business owners to understand the overall performance and health of the organization. These key performance indicators touch on various aspects of the business, from customer satisfaction to operational efficiency, ensuring the company is on track to achieve its strategic objectives.
If you're a manager or owner, consider the following KPIs.
- Customer satisfaction: The Customer Satisfaction or CSAT can be measured through surveys and feedback forms.
- Employee turnover rate: A measurement of the number of employees who leave the company in a given period.
- Net promoter score (NPS): A measurement of customer loyalty and satisfaction.
- Operational efficiency: Measure this KPI by tracking the ratio of input and output in any given process.
- Number of new customers: This measures the number of new paying customers in a certain period, such as quarterly.
Sales and marketing KPIs
Marketing and sales KPIs are vital for marketing managers, sales directors, and CMOs to measure performance of marketing and sales strategies, and to assess strategic goals. They provide insights into customer acquisition, retention, and engagement, helping teams refine their tactics to maximize ROI and drive growth.
If you're in marketing, consider the following KPIs.
- Customer acquisition cost (CAC): This measures the cost of acquiring a new customer.
- Customer lifetime value (CLV): This measures the total value a customer brings to a business over the entirety of their relationship.
- Conversion rate: This measures the percentage of visitors taking a specific, desired action — like purchasing or signing up for your newsletter.
- Sales growth: This measures the percentage increase in sales over a specific period.
- Lead-to-sale conversion rate: This measures the percentage of leads that convert into sales.
- Website traffic: This measures the number of visitors to a company's website.
- Social media engagement: This can be measured via likes, comments, shares, and other interactions on social platforms.
Marketers focus on key performance indicators that impact their objectives, just as other departments focus on their unique metrics.
HR KPIs
Human resources or people teams should be tracking KPIs too. Running a business takes a lot of time and effort from HR, and inefficiencies can cost businesses big. Tracking certain KPIs can close financial leaks and ensure teams are working productively and, most importantly, happily.
- Employee engagement: This tracks things like job satisfaction and how motivated and invested empoyees are in their work and the organization.
- Retention: Retention measures the amount of employees who stay working at the company as opposed to moving on to another job elsewhere.
- Time-to-hire: This tracks how long it takes on average for a hire to be made – whether through an agency or directly using your own recruitment team.
IT KPIs
For IT and tech teams, certain KPIs will keep them aware of how well their system is running and if they have any weak spots they need to tighten up. It also helps demonstrate reliability to stakeholders and supports service-level agreements (SLAs).
- Uptime: Measuring uptime gives IT teams a chance to see how successful and reliable their network is.
- Breaches: This tracks the security of the network, and helps teams understand how frequently they experience security breaches.
- System availability: This check critical applications and infrastructure are consistently accessible, minimizing downtime that disrupts business operations.
Related: 2023's top marketing KPIs explained
Each team focuses on their own key performance indicators.
Beyond financial, business, and marketing/sales, many other organizational departments also rely on KPIs to measure performance. Each department crafts KPIs based on specific goals and challenges, ensuring a focused approach to measuring success.
For example, human resources might prioritize employee engagement and retention metrics, while supply chain and logistics emphasize timely product delivery. Customer service KPIs can be tracking response times and satisfaction rates, and the IT department monitors system uptime and security breaches. These varied Key performance indidcators highlight the importance of tailored performance indicators across different organizational sectors.
KPIs in practice: how are they used?
Think of KPIs as a gateway, helping you turn high-level goals into actionable, measurable tasks. For example, by the end of the year, you may want to increase company revenue by 15%. This goal will likely involve all teams and departments. However, without some guidance, no one will know what steps to take to reach that goal.
Teams can focus on shorter-term goals fueled by feedback loops to break down this big-picture goal. The feedback is provided by ongoing key performance indicators, which help you determine where and when to pivot your strategy.
So, high-level KPIs relate to overall business objectives and performance, while low-level KPIs help individual teams measure the impact of their tasks and projects. By removing bottlenecks, each team will become more productive and purposeful. Imagine the goal is to boost overall company revenue. The marketing department might focus on generating more leads and signups. In contrast, the customer service group may focus on reducing customer churn rates.
Regardless of the department or goal, all KPIs must be well-defined. If you say you want to grow revenue this year, any increase in revenue would be acceptable. Saying you want to increase revenue by 15% is a different story — it guides what to achieve and when.
The SMART criteria works well for this:
- Specific
- Measurable
- Attainable
- Realistic
- Time-bound
.png?width=717&height=315&name=Quote%20(2).png)
Remember, data matters
As you focus on strategic KPIs, understand the role that data plays. As you refine your KPIs, your data sets and analytics capabilities may change. Understanding the relationship between your KPIs, data sets, and analytics tools will be crucial moving forward.
One challenge many organizations face is whether they have the best data for the most optimal metrics. If you can get that right, you'll enjoy a competitive advantage. With access to better data and better analytics capabilities, you'll achieve faster, more informed decision-making.
Also, as more data becomes available, don't be afraid to reevaluate your key performance indicators. Organizations that pivot in response to incoming data benefit from greater agility and continuous improvement.
Tip: When providing different analyses for varying stakeholders, lean on a data platform like Funnel. You can create dashboards for each stakeholder, showcasing the data they care about most. This data is automatically updated, boosting productivity while reducing the risk of manually-inputted errors.
Dive deeper with this article: Marketing data tools you can't live without.
The difference between leading and lagging KPIs
Key performance indicators can also be categorized based on leading indicators vs. lagging indicators.
Think about leading indicators as looking into the future, whereas lagging indicators provide a glimpse into the past.
- Lagging indicators measure what's already happened, like your year-to-date advertising costs. These indicators offer insight into the progress you've made toward key goals.
- Leading indicators can help you make strategic decisions and plan. For example, your number of inquiries could help predict future sales.
So, lagging indicators measure what you've achieved, compared to leading indicators, which focus on where your organization will likely achieve next.
Another example of leading and lagging indicators can be found in SEO: the number of links you are getting to your website is a leading indicator, because it can indicate future SEO success. But the number of website sessions coming from Google organic search can be a lagging indicator. It shows you have done the right things in the past.

How to choose the right KPIs for your marketing
It won't come as a big surprise that choosing the right KPIs for your marketing is important. After all, you want to make sure your marketing efforts drive meaningful results. The key is to focus on metrics that directly align with your business objectives rather than getting lost in vanity metrics that don’t impact growth (depending on your overall goals, these could be things like total website visits, social media likes, email open rates, or ad impressions without conversion context). We recommend you start by identifying your core goals – whether it’s increasing brand awareness, improving lead generation, or driving revenue. From there, choose KPIs that are specific, measurable, and actionable. For example, if your goal is customer acquisition, tracking cost per acquisition (CPA) and conversion rates will be more valuable than total impressions. It’s also important to consider leading vs. lagging indicators—leading indicators (like website engagement) can help you predict success, while lagging indicators (like revenue) confirm it. Once you have a set of KPIs that align with your goals, ensure that each team understands how their metrics contribute to the bigger picture. This is where a KPI tree can help organize and connect different performance indicators across departments.
How to build a KPI tree
As discussed, teams or units within an organization will focus on different KPIs. However, these varying KPIs feed the company's core objectives — a bit like a KPI tree.
When you build a KPI tree, you create a simple way to organize and track metrics to make sure goals are aligned with each department's strategies. This visualization tool depicts goals, methods of achieving them, and measurements for evaluating the success of each.
At the very least, your KPI tree should clearly define your organization's goals and the metrics involved. To build one, consider the following steps:
-
- Determine goals for your upcoming project, team, department, or company. The first level of branches will cover your objectives. Taking this step will align your KPIs with what you aim to achieve.
- The second branch should focus on developing strategies. Determine what techniques your team will use to progress toward organizational goals.
- Typically, the third branch focuses on practical, actionable methods. For example, if you aim to boost customer loyalty, you may concentrate on a rewards program.
- Now, it's time to choose KPIs for each outlined method. Select one or more KPIs to evaluate how well each process works.
- Lastly, test, test, test! Methods should be tested via your chosen KPIs. If your numbers are lower than anticipated, you may need to revise one of your KPI tree branches or select a better KPI to assess the method in question.
You could also create a KPI tree that showcases each team's role concerning a company's top-line goal. Here is an example:
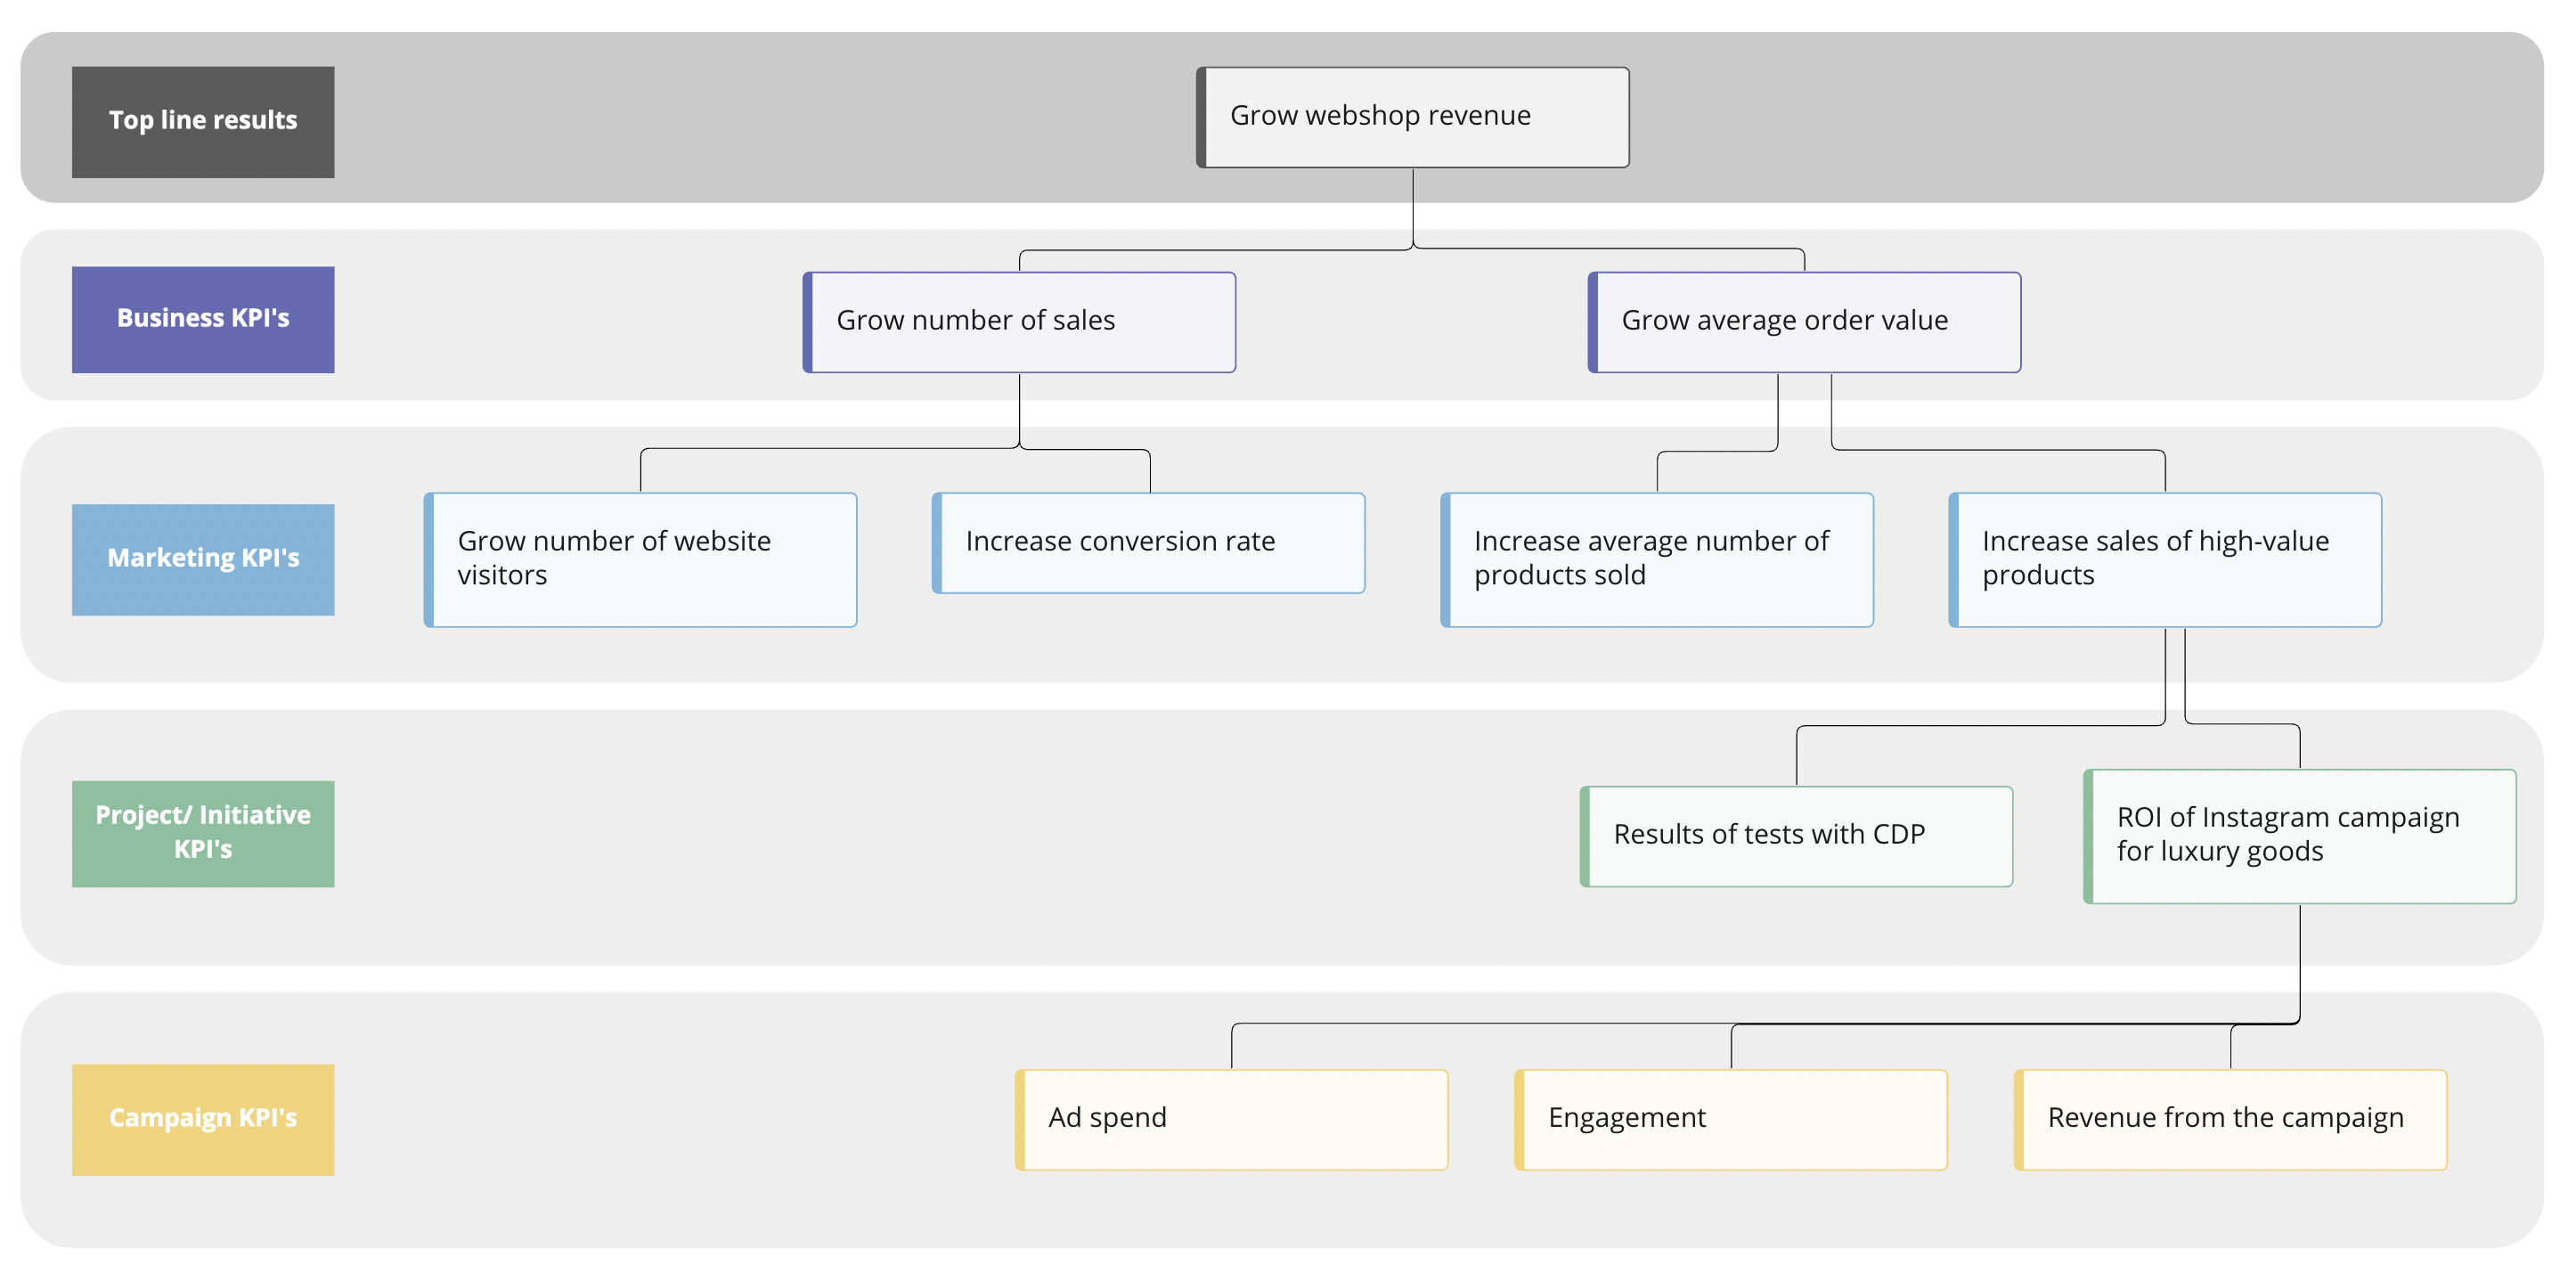
Example of a KPI tree. From our post on marketing reporting.
Calculating complex metrics
Some KPIs are straightforward, such as the number of new customers in a given period. But others require some calculation. Here are some examples of KPIs and how to calculate them.
- Net new MRR measures your company's monthly net growth. To calculate, add your monthly recurring revenue (MRR) from new customers and the revenue from existing customers. Then, subtract revenue lost from downgrades or churns.
- The gross burn rate is the total money you spend each month — the net burn rate is the money lost each month concerning company revenue. To calculate it, subtract the cost of goods sold and your gross burn rate from your monthly revenue.
- Burn multiple showcases the revenue you generate per dollar burned. To calculate this, take your net burn value and divide it by net new annual recurring revenue (ARR).
- Cost per lead is common among marketers, as it measures how cost-effective campaigns are when aiming to generate new leads. To calculate this metric, take your total marketing spend and divide it by the total of new leads.
Choosing the right KPI for your strategic goals
When it comes to KPIs, there is never a one-size-fits-all solution. The best KPIs for your organization or department will depend on your objectives — which can change over time. Be open to change, adapting your strategy as your goals evolve.
Less is more
Sometimes, it's better to have one North Star metric and two or three supporting KPIs instead of many KPIs for all the different organizational initiatives.
A North Star metric is the leading indicator to measure your success. You can have many KPIs, but you typically only have one North Star metric.
Here are some examples:
- Uber's North Star metric could be the number of trips
- Instagram's North Star metric may be the number of daily active users
- Airbnb's North Star metric might be the number of nights booked
Reporting on your metrics
People should report on different KPIs depending on who will see or read the report. Your audience matters. A chief financial officer (CFO) will look at CAC, LTV, and MRR, while a growth team will look at CPCs, CPMs, conversions, etc. Then, as teams or departments, you might have different KPIs that all feed into your main company objectives. Again, this is where a KPI tree comes into play.
Take the next steps
Defining the right metrics for your organization should be a top priority this year and beyond. Also, as digital transformation continues and automation increases, it's essential to treat KPIs as a special data asset.
As time progresses, consider using KPIs not as an output for human analysis but as machine inputs. For instance, advertising platforms such as Google and Meta have the ability to dynamically adjust the audience for your ads based on the Key Performance Indicator (KPI) that you deem to be the most important.
If you prioritize clicks as the most significant KPI in your campaign, the platform will display the ads to users who are more likely to click on links in ads. However, if you prioritize video views as the most crucial KPI in your campaign, the platform will show your ads to users who frequently watch videos. In the digital world, KPIs are now essential inputs for automated decision-making.
FAQs
To provide clarification, here are some common FAQs on key performance indicators (KPIs).
KPIs (key performance indicators) vs. a metric - what's the difference?
The terms key performance indicator / KPI and metric are often used interchangeably. However, they are not identical.
- A metric is a data point you can measure — like clicks, page sessions, impressions, etc.
- KPIs are very similar in that they are metrics. However, they are metrics you find so important that you want to track them based on strategic objectives, initiatives, and goals — like revenue growth or user acquisition.
Again, the most critical metrics vary from team to team. Someone in SEO may choose organic sessions and the number of keywords as their top KPIs, whereas a performance marketer running campaigns may select impressions, clicks, and cost per lead.
What is the value of using KPIs?
Using KPIs provides an organization with many advantages, including:
- KPIs help guide management, as they help leaders anticipate what the future may hold so that they can develop more informed decisions.
- When implemented properly, KPIs align an organization. People and processes are better aligned, and data-driven KPIs promote greater agility.
- KPIs can offer an integrated customer overview, as the traditional sales funnel no longer exists in terms of staying linear throughout. You can boost engagement by framing KPIs around customer awareness and their anticipated needs.
- The ability to make real-time informed decisions, as the factors influencing KPIs, like sales conversion rate, vary depending on location, platform, or time of day. If you take the time to analyze your data in real time, you will be better positioned than organizations that only conduct retrospective analyses.
- Sharing KPI data across an entire organization promotes cross-functional promotion. The goal is to minimize friction across all business units.
- Leverage KPI data for machine learning to improve performance — predictive values help influence strategic planning and decision-making across time.
Why should you limit the number of KPIs you track?
If you're fleshing out a new strategy to identify KPIs for your business, know that less is often more. Instead of selecting dozens of KPIs, focus on just a few. If you start working with too many KPIs, you may become overwhelmed and lose focus.
Aim for two to four KPIs per goal. You will gain access to enough data to know where you stand without getting lost in a slew of data. For example, if your goal is to increase the number of signed contracts by 7% each quarter, you may track KPIs such as the number of qualified leads per month, average time for conversion, and the number of contracts signed per quarter.