



By: Pär Arvidsson, Technical Product Manager
When you build an analytical model from individual transactions or events, you usually have somewhere to go back to. If a report needs a different breakdown, you can revisit the underlying records. If the definition of a metric changes, you can recalculate it. There are still constraints, but having the relevant detail gives you room to change your model.
At Funnel, we often start further downstream. An advertising platform has already processed the underlying activity, applied its definitions, and aggregated the result. What we receive is a report. We then need to model that data again so it can be used alongside reports from other platforms. That means understanding both what the data represents and what it can no longer tell us.
This creates a different kind of modelling problem: before deciding how to answer a question, we need to establish whether the available reports contain enough information to answer it at all. More storage, a faster query engine, or a different schema cannot recover detail that was removed before the data reached us.
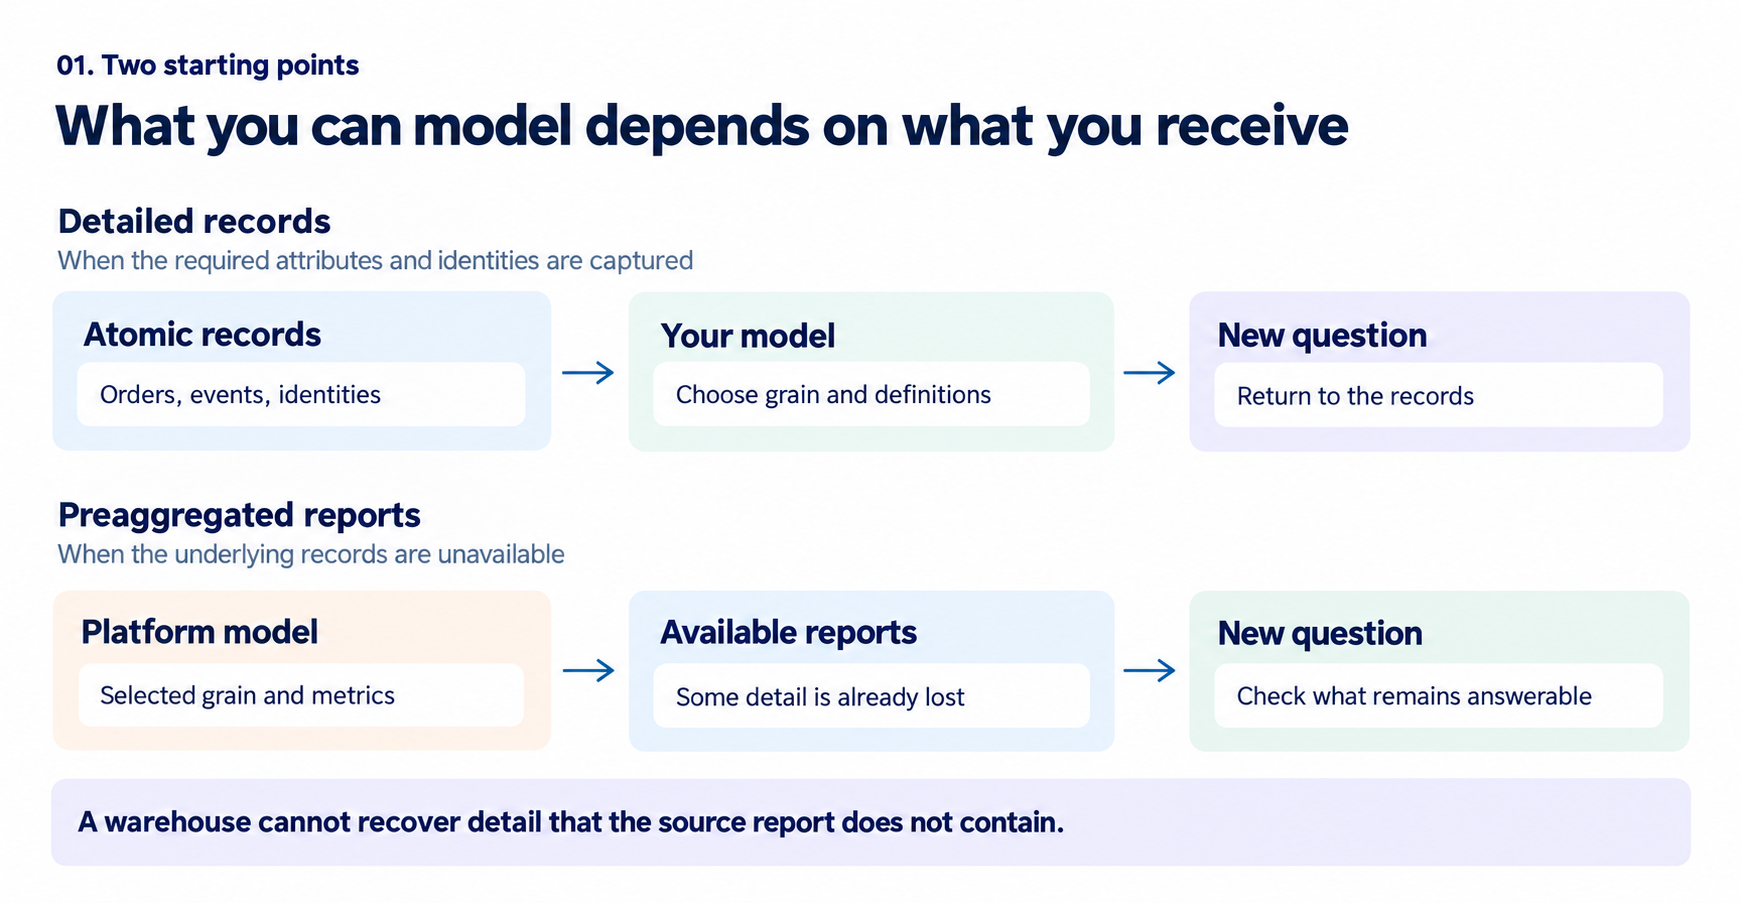
When you have the underlying records
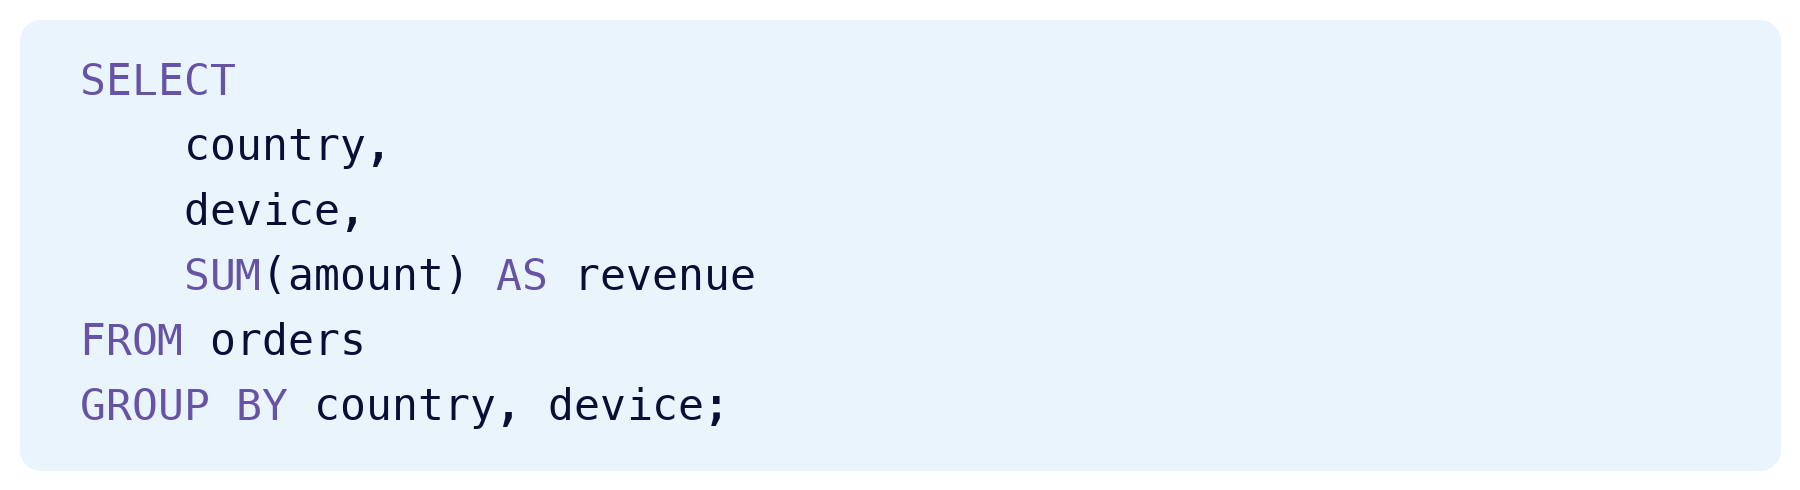
Consider a warehouse containing individual orders. Each order has an identifier, a customer, a timestamp, a country, a device category, and an amount. To calculate revenue by country and device, a data analyst might write:
If someone later asks for revenue by customer and month, the same underlying records can support a different aggregation. You still need to understand the data. Joining orders to order lines can duplicate amounts. Refunds need a definition. Historical customer attributes may require careful handling. Having detailed records does not remove the need for modelling.
But it does give you the ability to derive different views from the same evidence, provided the required attributes and relationships were captured. With preaggregated reports, that freedom is narrower.
Two breakdowns do not give you a third
Imagine an advertising API gives us two reports for the same period:
- Spend by country: North 60, South 40.
- Spend by device: Mobile 60, Desktop 40.
Both reports total 100. Now someone asks how much was spent on mobile devices in the North. We have country, device, and spend. All the requested fields exist. But we do not have the relationship between country and device.
The following two distributions produce exactly the same reports:
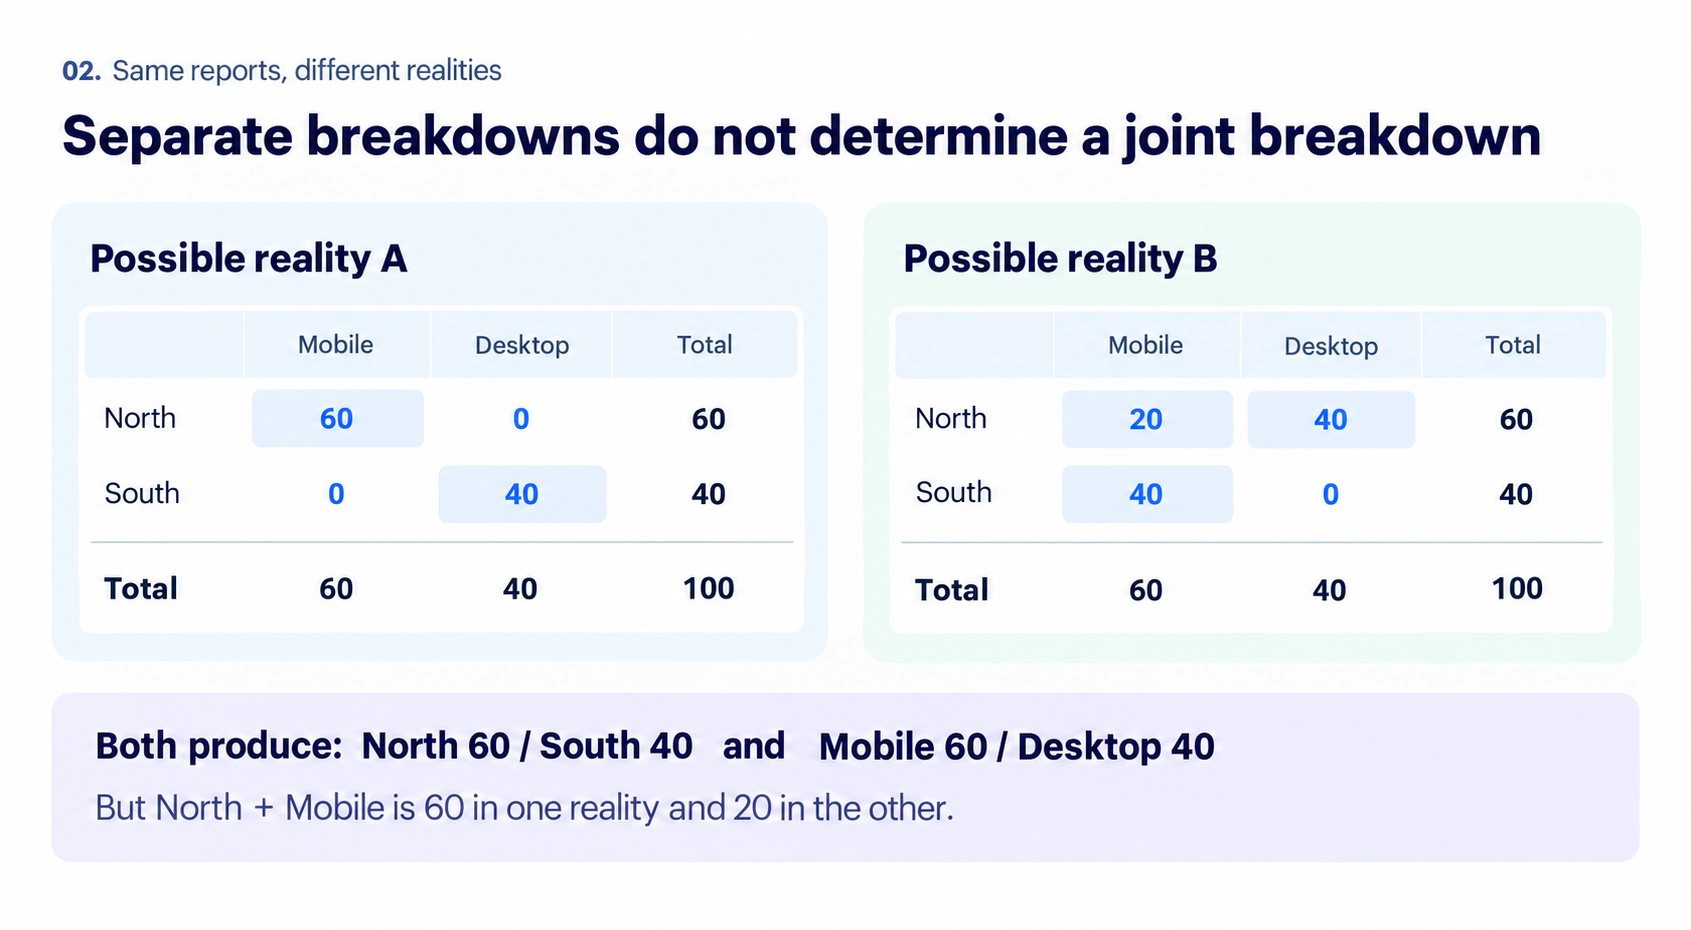
In one case, the answer is 60. In the other, it is 20. The reports cannot tell us which is correct. In statistical terms, we have the marginal totals, but not the joint distribution. Joining the reports on their reporting date cannot recover that distribution. Allocating spend proportionally would introduce an assumption, producing an estimate rather than recovering an observed value.
If we owned the underlying records with both attributes, we could group them differently. Here, we would need another report from the source that includes the combined breakdown—if the source offers it. Moving the two existing reports into a warehouse does not change this. The constraint follows the information available.
Aggregated values have different rules
Even when a report contains the dimensions we need, its metrics may behave differently when we aggregate them again. Spend can often be summed across non-overlapping groups, assuming compatible currencies and definitions. Distinct counts need different treatment. Suppose a platform reports that we reached 100 people on Monday and 120 on Tuesday. How many people did we reach across both days?
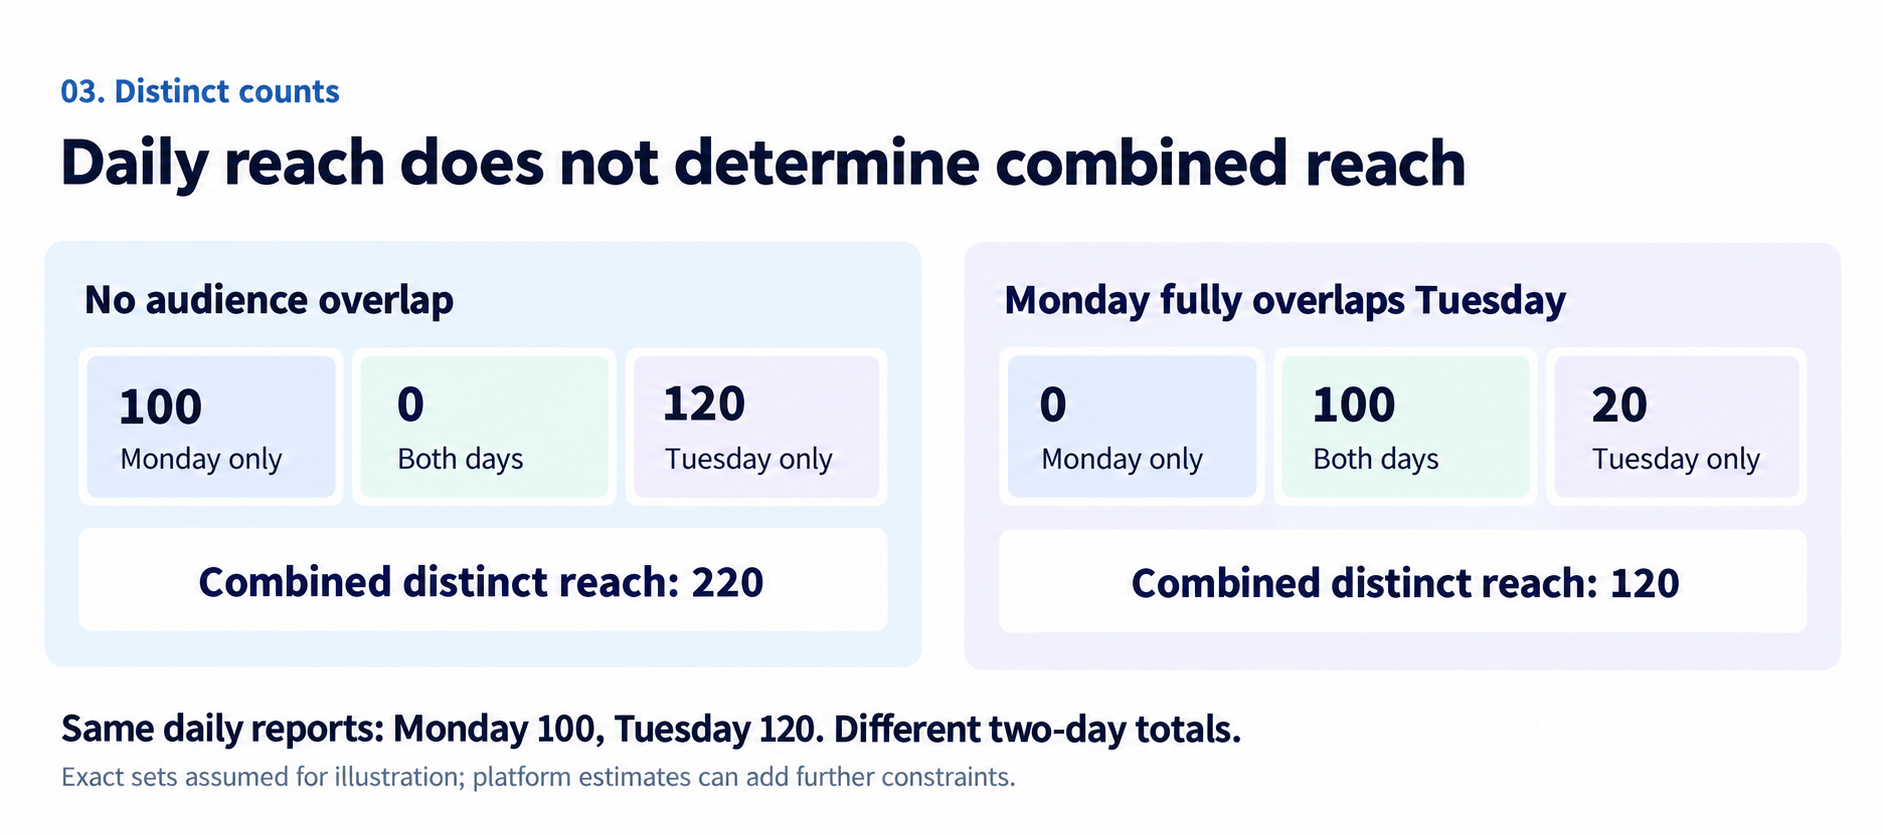
For exact sets, the calculation is:

The two daily counts do not contain the overlap. The combined count could be anywhere from 120 to 220. With individual exposure records and a stable person identifier, a warehouse could calculate a distinct count across the period. With only daily counts, we cannot reconstruct the same answer. These are deliberately simplified examples. Estimated metrics and platform-specific definitions can impose further constraints. But the information problem exists even with exact counts.
Other metrics require retaining different information. An average can be recombined if we have the appropriate counts and weighting. A click-through rate can be recalculated from compatible click and impression totals. Averaging the reported rates directly generally answers a different question. A numeric type tells us how a value is stored. It does not tell us which operations preserve its meaning.
More reports can mean more overlap
There is another complication: additional reports do not necessarily represent additional activity. A campaign report might contain spend of 60 and 40. An account report might contain spend of 100 for the same activity. Each report is useful. Summing across both gives 200. This is not ordinary row deduplication. The rows have different dimensions and different values. They are alternative representations of the same underlying facts.
A data engineer working from atomic records can often build several aggregate tables with known lineage. That lineage helps establish when the tables are alternatives and when their contents can be combined. When consuming externally produced reports, we need to establish those relationships from the source’s reporting behaviour and the available declarations. Matching column names is not enough.
Semantics need to describe what is possible
This changes what we need from a semantic model.
A mapping from a native field to a shared concept such as cost is useful, but it only answers part of the question. We also need to understand:
- Grain: what one row represents.
- Metric behavior: which aggregations remain valid, and which supporting values they require.
- Coverage: which activity a report includes.
- Compatibility: which dimensions are available together.
- Overlap: whether datasets represent separate activity or alternative views of it.
These properties determine whether a requested result can be derived from the available reports. For example, two datasets may both support total cost by date, while only one supports a device breakdown. Returning the second dataset alone could produce a valid-looking table that silently excludes part of the requested spend. The model therefore needs to support reasoning about the question as a whole. Finding each requested field somewhere in the available data is insufficient.
Validity comes before optimization
In a familiar warehouse workflow, we might choose between scanning detailed records and using an aggregate table that preserves the information needed by the query. When the aggregate reports are all we have, there may be no more detailed fallback. Before considering which execution plan is efficient, we need to establish whether the available data can support the requested answer. That includes recognizing when it cannot.
This is the challenge behind modelling data that has already been modelled by someone else. We want to make the available reports useful together, while preserving the boundaries imposed by their definitions and lost detail. The semantic layer cannot recreate information that was never delivered. Its job is to help the platform use the information it does have correctly—and make the limits visible when a question asks for more.