We've just released a brand new connector. Google Trends!
Connecting a new Google Trends source will give you the dimensions Keyword and Geo and the the metric Interest. You have the option to specify between one to five keywords and a region (worldwide is the default).
Google Trends normalizes data to make comparisons between terms easier. Search results are normalized on time period, region and the relation between each selected keyword. Following this process:
-
Each data point is divided by the total searches of the region and time period. Otherwise, places with the most search volume would always be ranked highest.
-
The resulting number, called "interest" will be a value between 0 and 100. A value of 100 is the peak popularity for the keyword. A value of 50 means that the keyword is half as popular. A score of 0 means there was not enough data.
Our connector gives you a daily granularity on a month to month time range to determine the interest of one or several keywords over time.
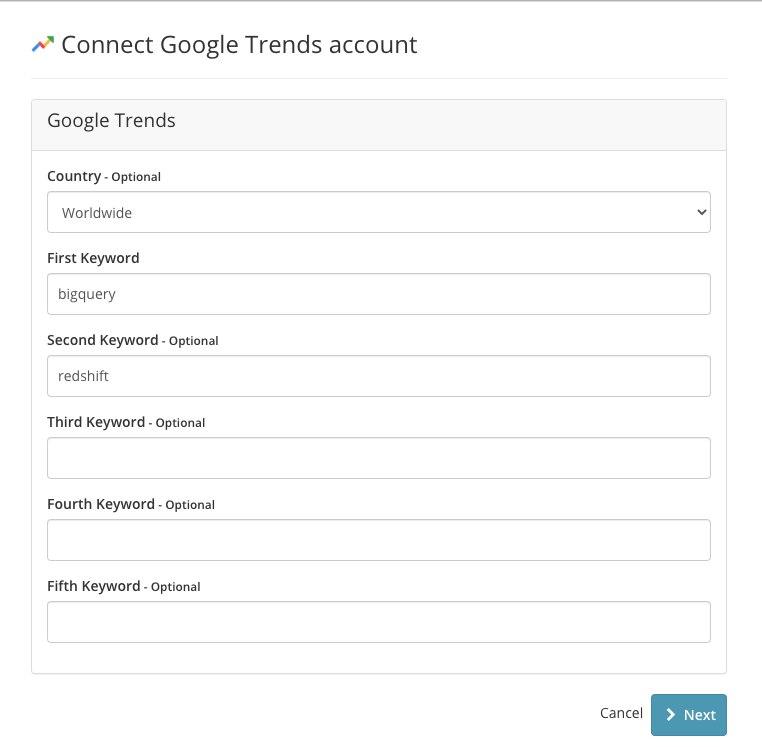
Let's look at an example. If we want to compare the relative popularity of the search term "bigquery" and "redshift" worldwide, we would connect a new Google Trends source using these options:

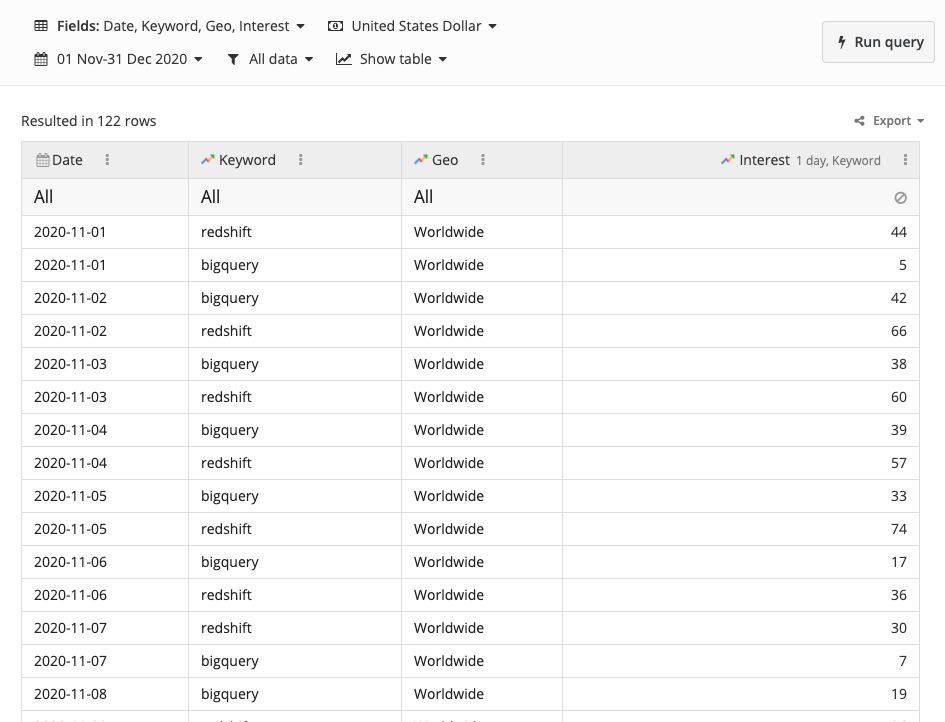
This will give you Interest on a daily granularity split by the Keyword and Geo dimensions. Like this:

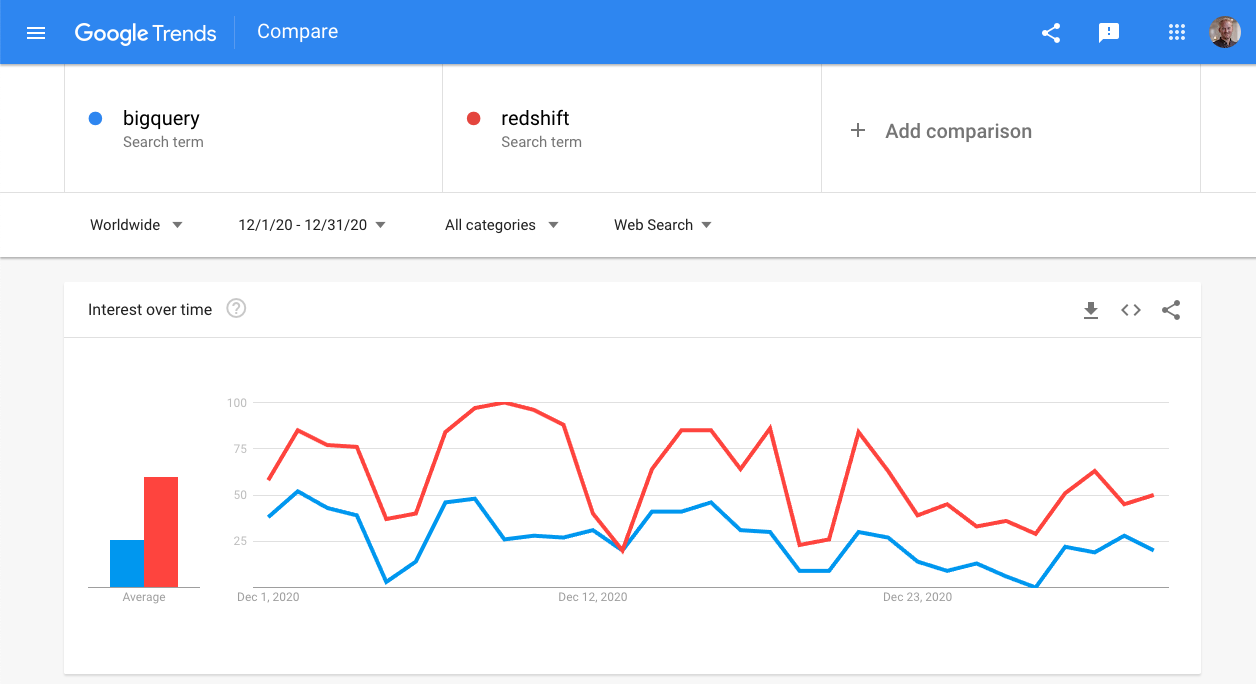
The data is fetched in chunks of months. So, Jan 1 - Jan 31, then Feb 1 - Feb 28, etc. In order to match what you will see in Funnel in the Google Trend interface, you would set the date range between the first and the last of the month, and repeat that for each month you want to compare.
This Google Trends view would match what you see in Funnel for December 2020.

Google Trends can be a powerful tool for optimizing keywords or spotting market trends. We hope this will be a great addition to your marketing performance reporting. If you have any questions or feedback, do not hesitate to reach out by sending an email to support@funnel.io or write in via the in-app chat.

