Facebook Ads is a behemoth of a platform. Combined with other Meta properties, it took in more than $112 billion in ad revenue in 2022 — second only to Google. In fact, Meta took in more advertising revenue than its next three competitors, combined.
The reach, ability to target, and powerful algorithms driving the platform are a few of the reasons why marketers all over the world flock to Facebook Ads. But, it’s not enough to simply advertise on the platform. You need to understand how your ads are performing and where improvements can be made.
So, how do you go about analyzing your Facebook Ads to ensure you’re getting the most from the platform? Glad you asked…
The importance of the ad creatives
As we covered in our series about the future of performance marketing, your ad creatives are one of the three pillars of modern marketing. And to understand and improve your performance on Facebook Ads, you’ll need to test and iterate on multiple creatives at once.
If you’re a high-volume advertiser, you can even test up to 50 ad creatives at one time with Meta Advantage+. For today’s purposes, though, we’ll focus on how we go about testing and optimizing three ad creatives.
Related reading: what is performance marketing?
A mix of creatives
We developed and ran three different video ads: a currency conversion tutorial, a fictional Zoom call about currencies, and an ad showing how Funnel can help you multitask. Our rationale for each creative varied a bit and used different mixes of original videography and screen capture clips to communicate our message.
While the first two ads addressed real-world issues marketers face daily, the third video (our multitask creative) sought to convey how Funnel makes a marketer’s life so much better. Each ad was also designed to reach prospective customers at different stages of their consideration cycle.
Analyzing creative performance
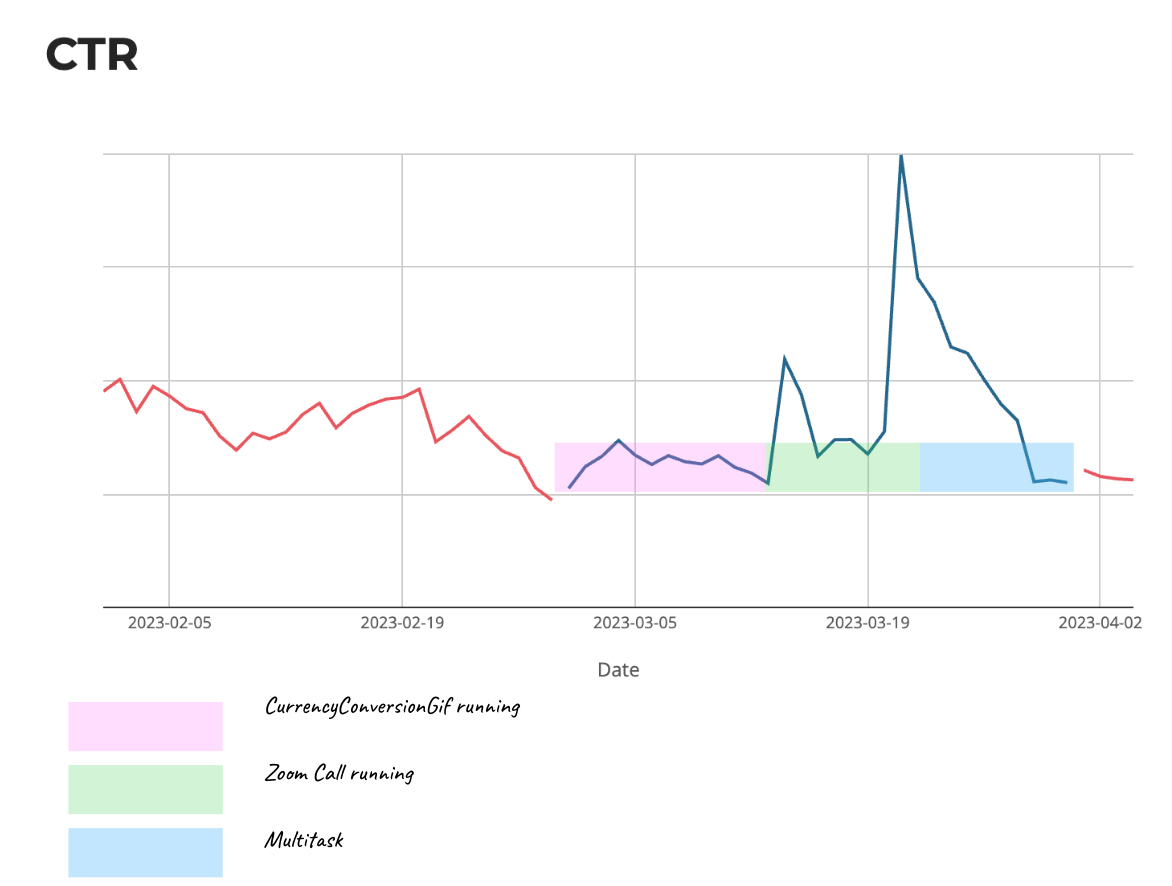
To kick things off, we uploaded each of our three creatives to Facebook Ads. Overall, we saw very little impact from the currency conversion tutorial ad, highlighted by the pink bar in the graph below. However, we experienced a large spike in the click-through rate for both the Zoom call and the multitask creatives. 
It’s an intriguing result, which means it’s time to dig a little bit deeper to understand what’s really going on.
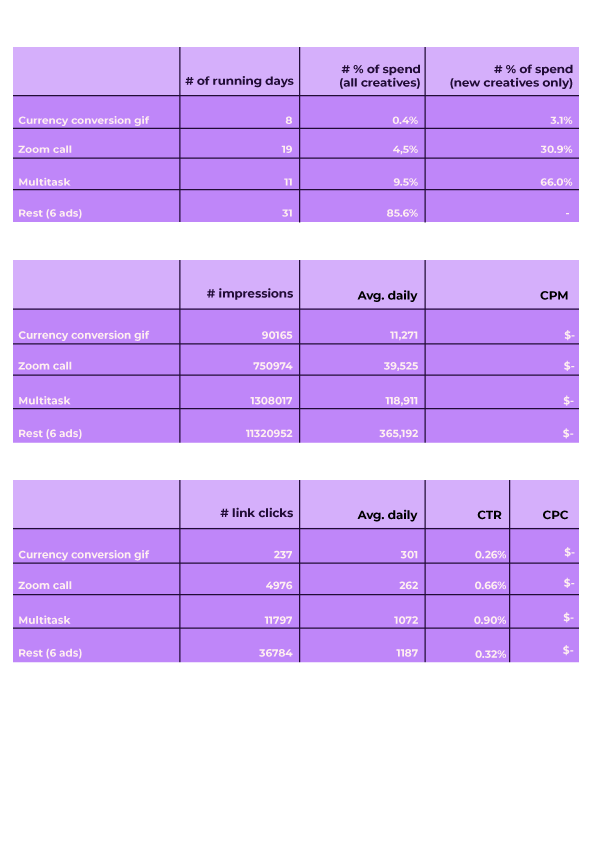
The tables below show how each of our three creatives performed against different metrics. At the top, you can see how much share of display that each ad won on Facebook Ads. This can help identify which ad creative was deemed the most effective by Meta’s algorithm.
The second table shows impressions and the cost per thousand impressions. Finally, the third table itemizes clicks, click-through rate, and cost per click. Each of these metrics serve toward supporting our KPI: conversions. 
As you can see, the multitask creative won the greatest amount of spend from the algorithm, earned the greatest daily average impressions, and had the best click-through rate.
Of course, once the Meta algorithm chooses a “winner,” it will naturally gain the most impressions and clicks. So, let’s dig a little deeper into this data.
Facebook’s preferred metrics
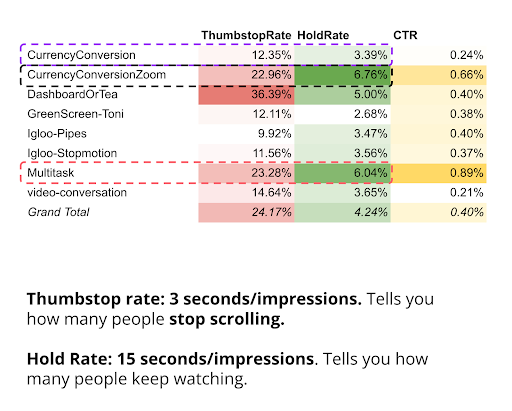
While we can evaluate our ad performance based on conversion efficiency, Facebook also has three metrics that help the algorithm determine winning creatives. They are, of course, thumbstop rate, hold rate, and click-through rate.
Thumbstop rate is a measure of how many people stopped scrolling thru feed and kept your creative in view for at least three seconds. Meanwhile, the hold rate measures how many people stopped on your ad creative for at least 15 seconds. In other words, thumbstop rate is your efficiency of halting a user’s scrolling while hold rate tells you who is engaging and watching your ad. 
In the table above, you’ll see that the currency conversion tutorial had, by far, the lowest thumbstop and hold rates. It’s no surprise, then, that this ad creative performed more poorly overall and was not favored by the algorithm.
Results-based metrics
Facebook Ads data is great, but they can only tell us part of the story. In order to get to the truth, we need to combine this data with what happened in the next stage of the customer journey. We need to dig into our CRM and analyze our sales data to see how many leads actually converted from our Facebook Ads campaign.
Now, it’s important to note that attribution is not clear cut (as much as we would like it to be). Plus, the conversions we can attribute to Facebook ads aren’t representative of the total value we get from the platform. For today’s purposes, though, we’ll take a quick view of our conversion data for illustrative purposes.
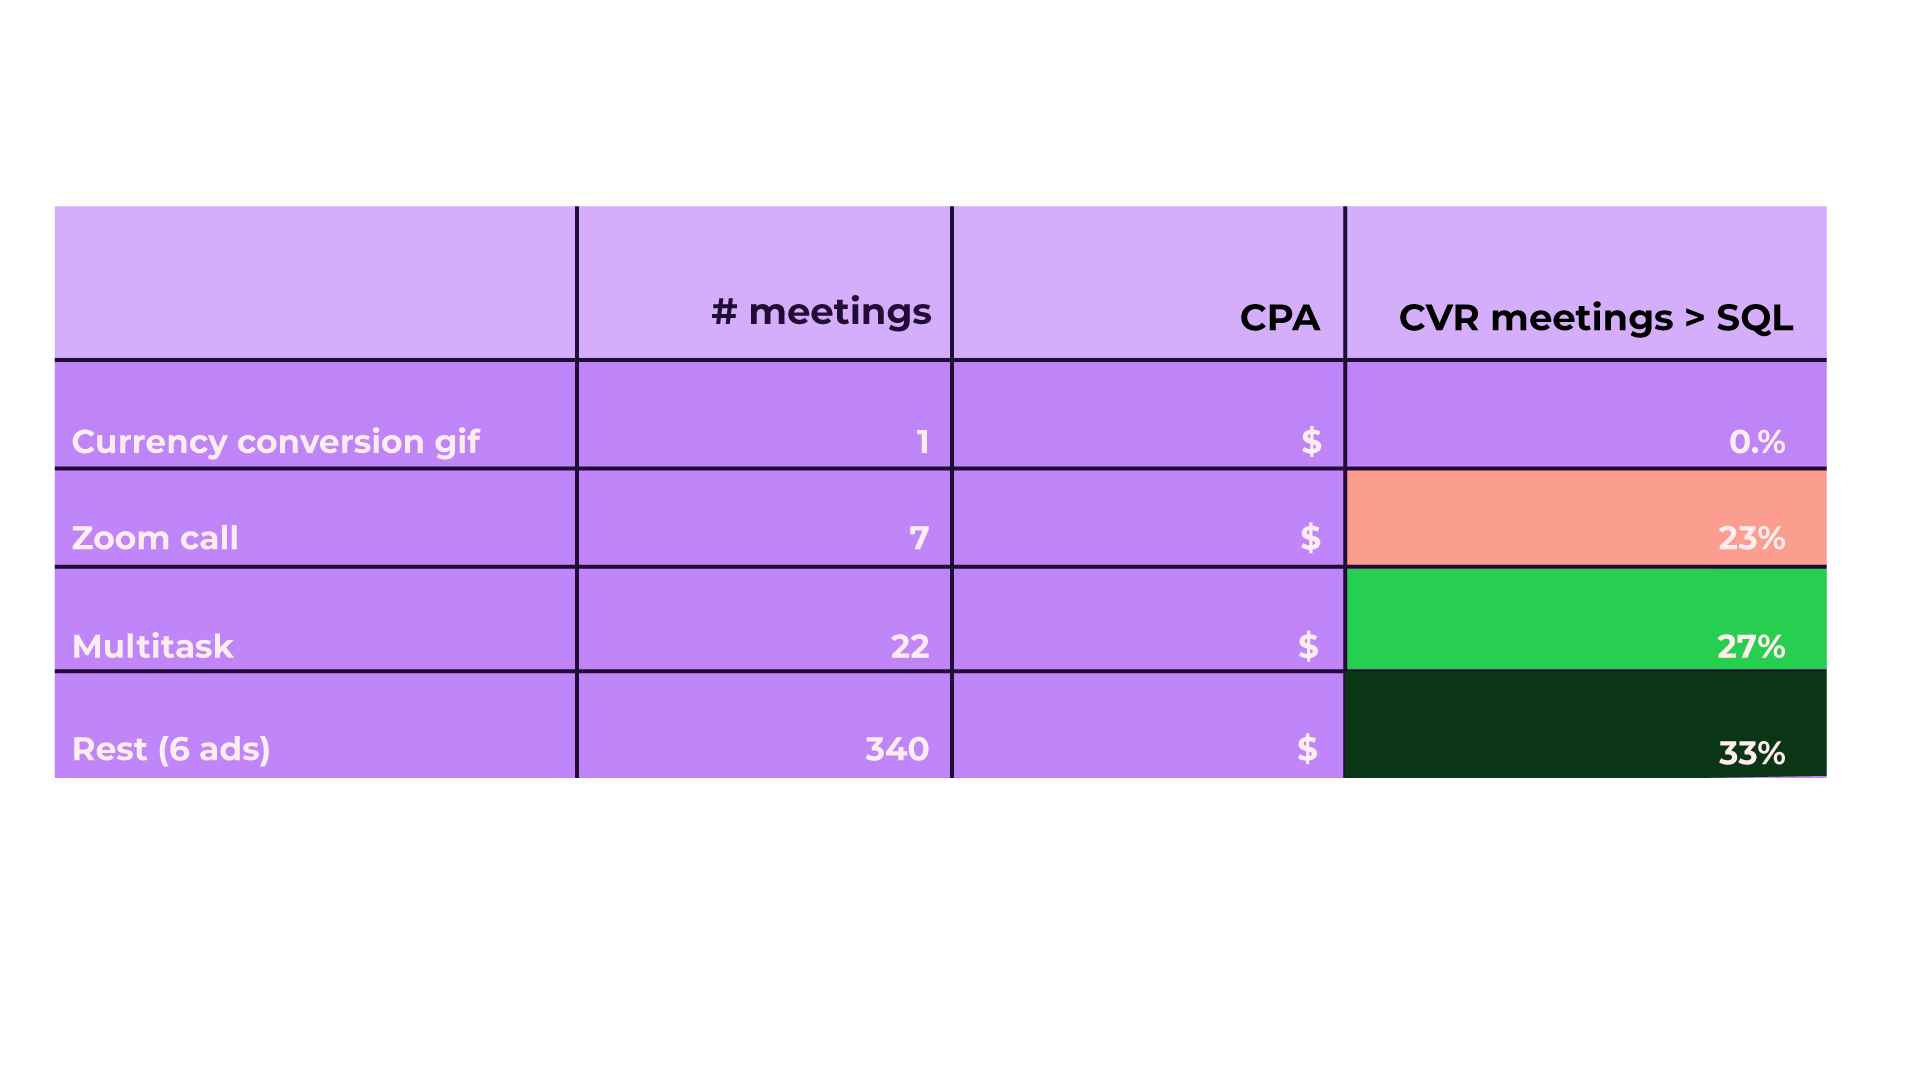
In the chart below, you can see how many initial meetings were booked with the sales team from each of the three creatives. You can also see how many of these meetings led to the sales rep designating that contact a sales-qualified lead (or SQL). Again, the multitask ad creative led the pack on meetings booked and SQL generation. But why exactly did the multitask ad get preferential treatment from the algorithm? 
The answer lies in how we optimized the flow. Our priorities were to get people to the website, then book a demo with high enough intent that they become an SQL. The multitask ad creative had a better click-through rate than the other two creatives. Plus, it had the highest rate of booked meetings. It achieved everything we told Facebook we wanted — so the algorithm quickly determined that the multitask ad was the best way to reach our goals.
Now what?
Data is great for learning what happened in the past, but you’ll need human intuition in order to learn from that data and make a plan to achieve success in the future. So what did we learn from these three creatives?
Our first learning was that the currency conversion tutorial needed a better hook, whether that is in the script or the visuals. It simply didn’t capture enough attention to stop Facebook users from scrolling.
Our second learning was that the Zoom call, no matter how creative and funny, didn’t really work in the context of a Facebook feed. It took a bit too much time for user’s to understand what was going on.
Our third learning is that while the multitask creative was great at capturing attention and driving booked meetings, those contacts didn’t convert to SQLs as often as we normally hope. Based on some qualitative data from our sales team, it seemed those potential customers booked a meeting but still didn’t really understand what Funnel did.
The moral of the story: there’s always room for improvement.
The trick to analyzing Facebook Ads
Every business will optimize their campaigns differently based on their own strengths, sales team, product value, and business goals. That means every ad creative and campaign will have different strategies at play.
And while every campaign is unique, there are a few core strategies for analyzing your Facebook Ads data. First, as may be our mantra, always test. Running multiple creatives allows you to establish baseline performance levels and evaluate new creatives based on any jumps in performance — just like we saw the peaks in click-through rate.
Don’t stop at monitoring upticks in performance. Get comfortable digging into your data to understand how your creatives are performing against your preferred metrics. And remember, Facebook Ads data is only one side of the story. You’ll need to join that data with sales data from your CRM platform to gain the full picture of performance.
As you begin to understand which creatives drive performance and sales, you can begin to learn what works for your audience on Facebook, and make adjustments for continued success.
If you’d like to learn more about how to analyze Facebook Ads data, be sure to check out our latest YouTube video. While you’re there, be sure to like and subscribe so you can stay up to date with all the great tips and tricks you need to be a better data-driven marketer.
