
When it comes to working effectively with data from multiple sources, transformation will inevitably become a critical part of your process. As we’ve previously covered, though, you can quickly find yourself deep into the subject of data transformation. So today, we will highlight a couple of data transformation examples that you can use to perform better analysis today.
Just as a quick refresher, data transformation is the process of modifying your data in some form. It implies enabling reactivity to change, enabling actionable insights, and understanding performance across and within the platforms.
In this article, we will try to describe a few different data transformation examples needed at some point in every marketer's journey and how Funnel helps to automate them.
From raw data to actionable insights
Think of raw data as an uncut diamond. In its original form, extracted from its source, it may not appear valuable. But with a little modification, that data can shine.
The issue is that each marketing data source tends to have its own format and naming schemes for the raw data (or the diamonds in the rough). That makes it incredibly difficult to compare performance across platforms.
Let’s take, for example, a metric that you might think is standard: cost. Facebook calls this “amount spent,” while Twitter calls it “spend.” Meanwhile, Google Ads calls it “cost.” It’s all the same thing, but it’s named something slightly different within each platform. Time for our first data transformation example.
Example 1: Aggregating Data
When you aggregate data you combine the fields coming from different platforms. It’s typically used when comparing how different platforms are performing, or how various accounts from the same platform are performing.
You can compare on a high-level or a granular level. Some examples of comparisons are:
- How much are we spending on each platform this month?
- Which campaign is performing better on Facebook?
- Which campaigns are performing best in all of our current marketing channels?
Say you’re an e-commerce company (maybe you really are) and you’re running a campaign on different platforms like Google Ads, Bing, and Facebook. One of the metrics you’re tracking might be the traffic to your website that is generated from each platform.
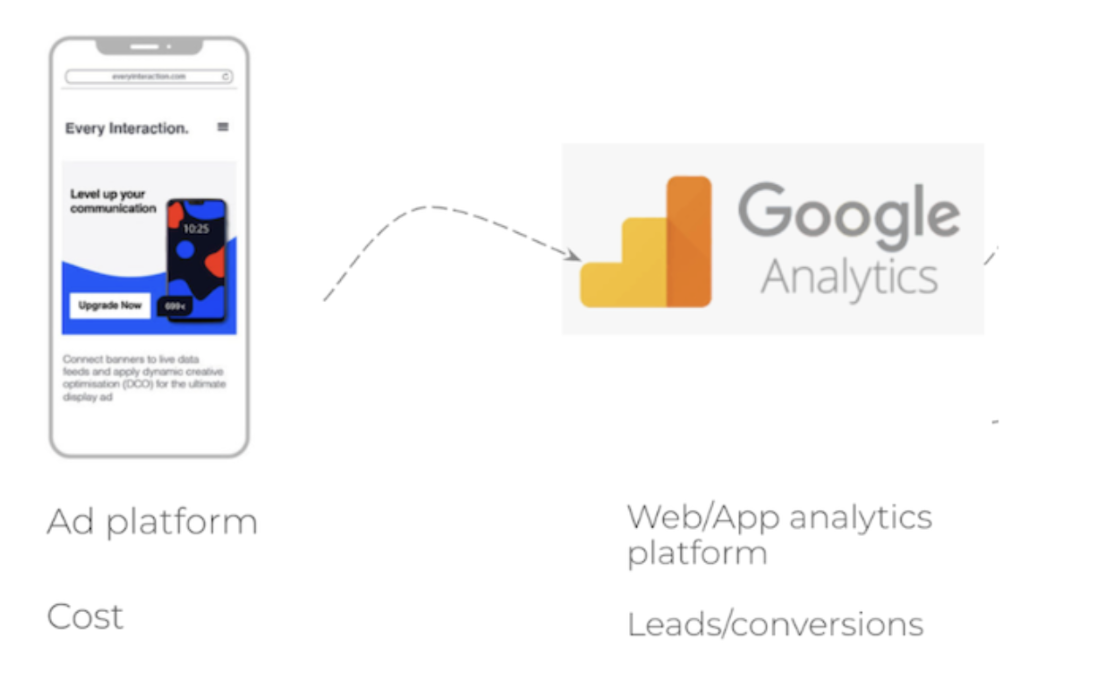
As each of those platforms generates data, you will need to aggregate it in order to compare how they are performing against one another.
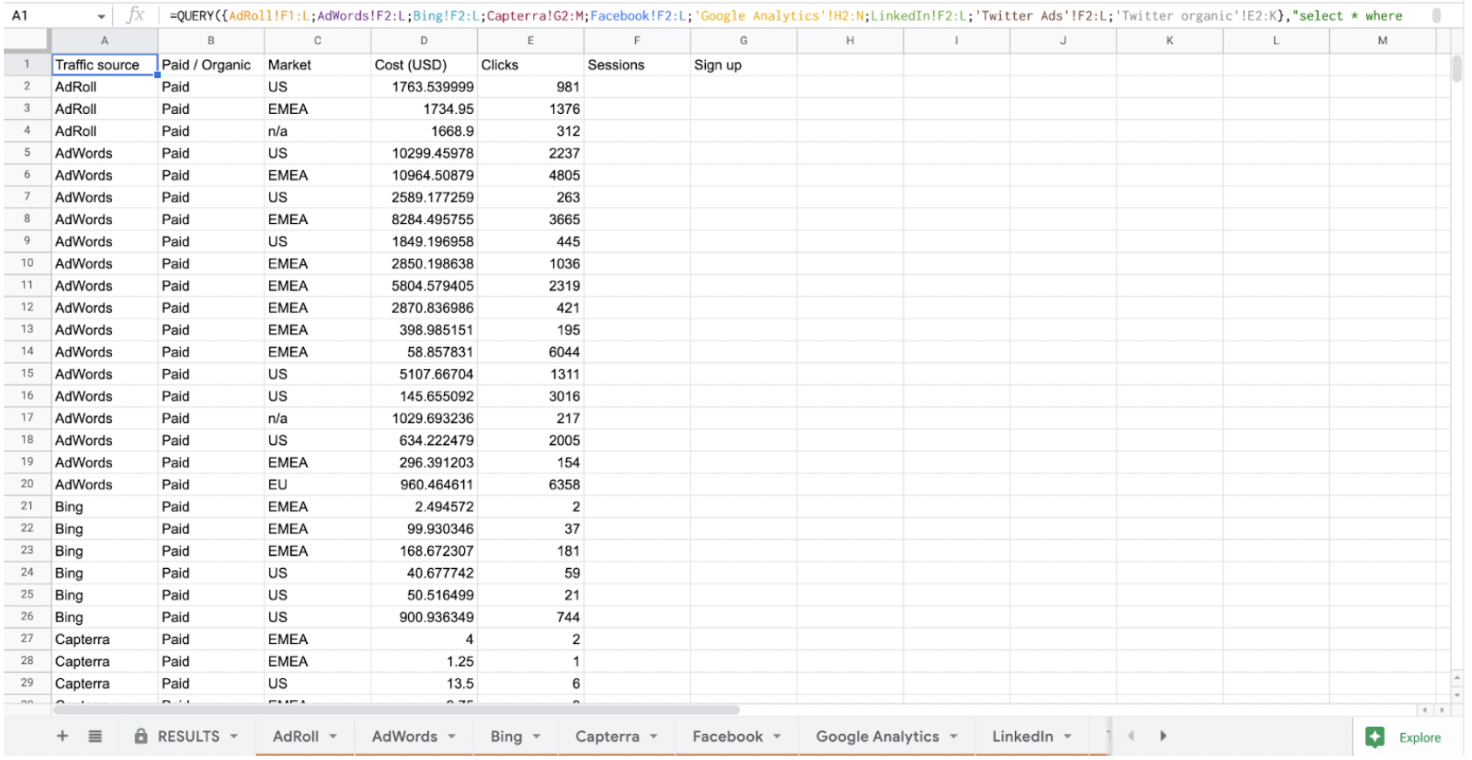
To do this, you need to combine the dimension of “traffic source” from each of the sources into one.
In a Google sheet, it could look something like this:
Meanwhile, in Funnel, the same logic would be applied, but it wouldn’t require using formulas across multiple sheets that could be prone to breaking.
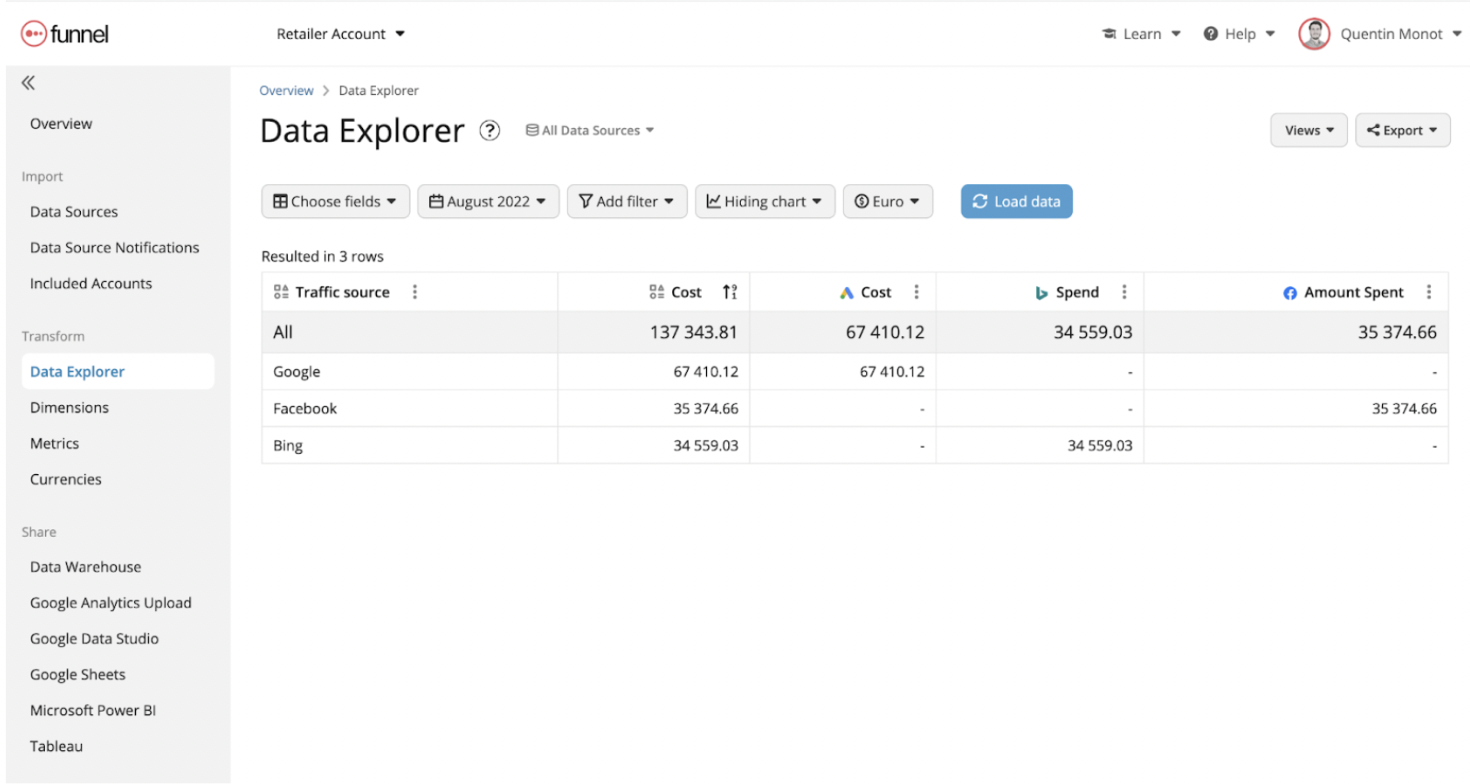
Instead, Funnel automatically generates custom aggregated dimensions for the most common fields like traffic source, campaign, media type, and a few others. You can see this in the example below.
While reviewing our performance in Data Explorer (as seen below), you can see the custom fields presenting an ordered aggregated view of the cost, and next to it the siloed platform-specific fields:
The aggregation would be the first transformation step in order to generate an overview of the data.
Example 2: Harmonizing Data
Another great data transformation example is harmonizing data.
Let’s revisit our previous example of our e-commerce company tracking our website traffic. Let’s say that, on top of traffic, you also are tracking your converted leads with Salesforce.
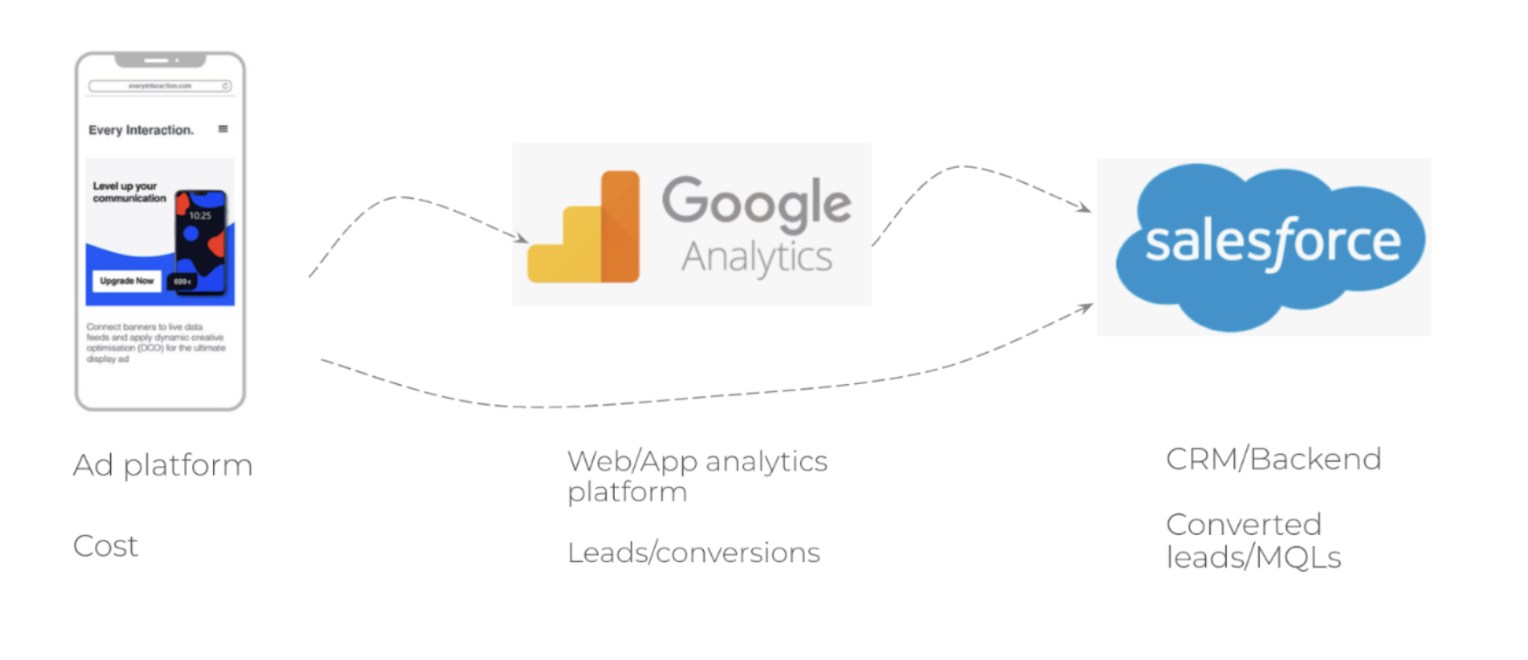
In this case, the field “campaign” is being generated in three different environments that you need to connect.
At Funnel, we always encourage that data is imported as cleanly as possible. If you want to dive deeper into this topic, have a look at these two articles on our blog:
In reality, though, your data from multiple sources may not be harmonized. So, you will need to transform data in order to gain the insights you are looking for.
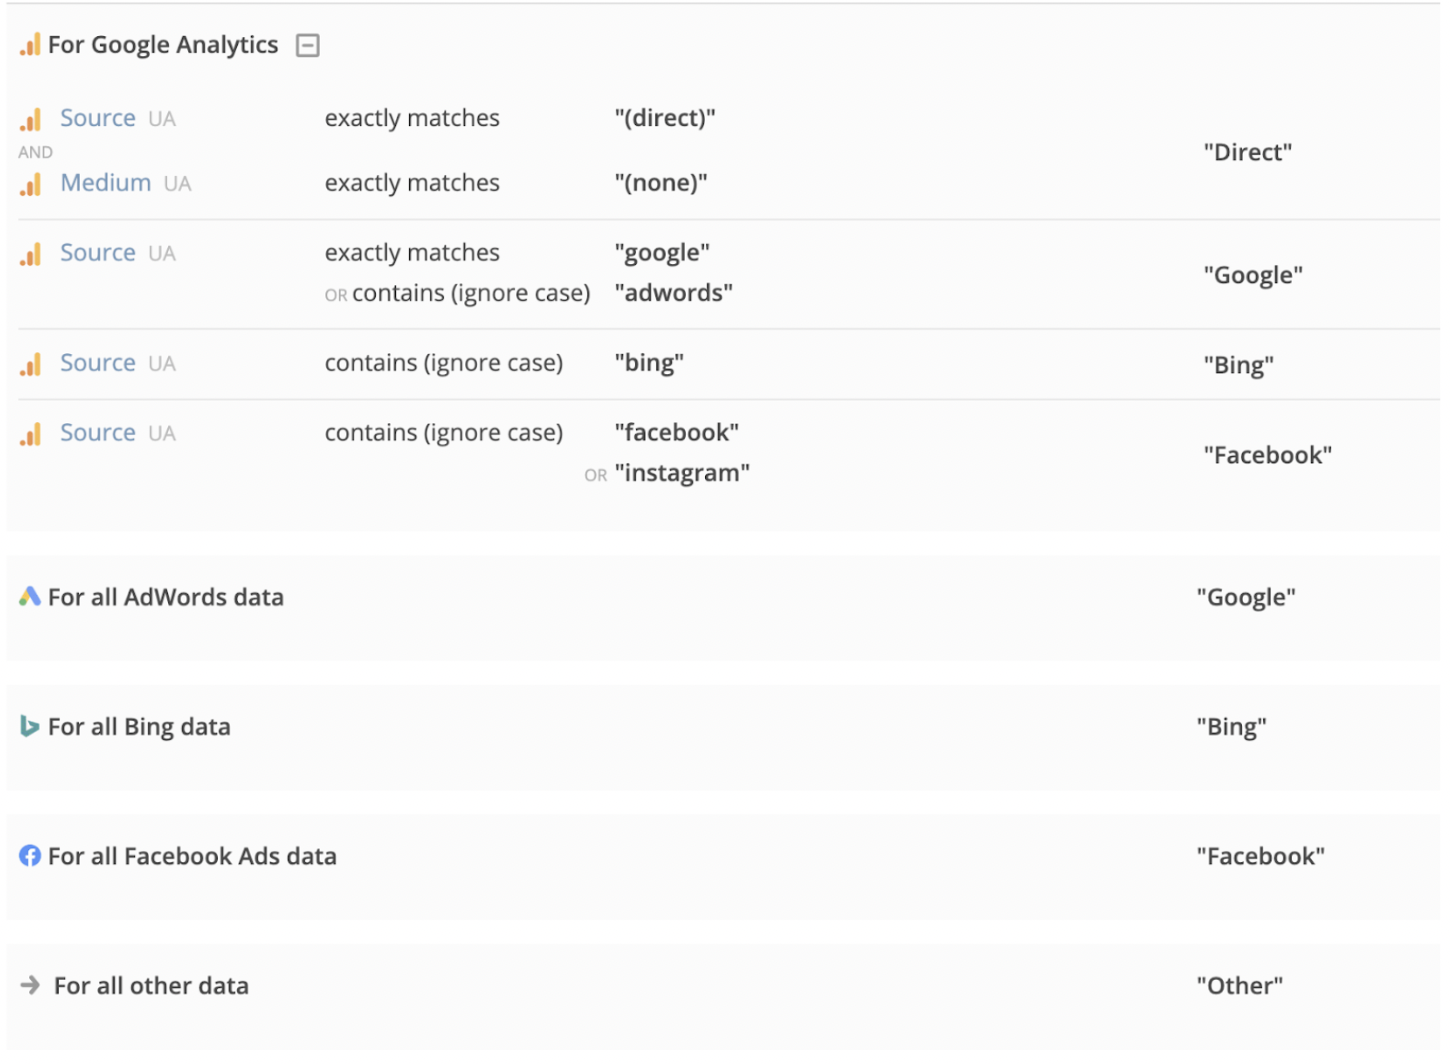
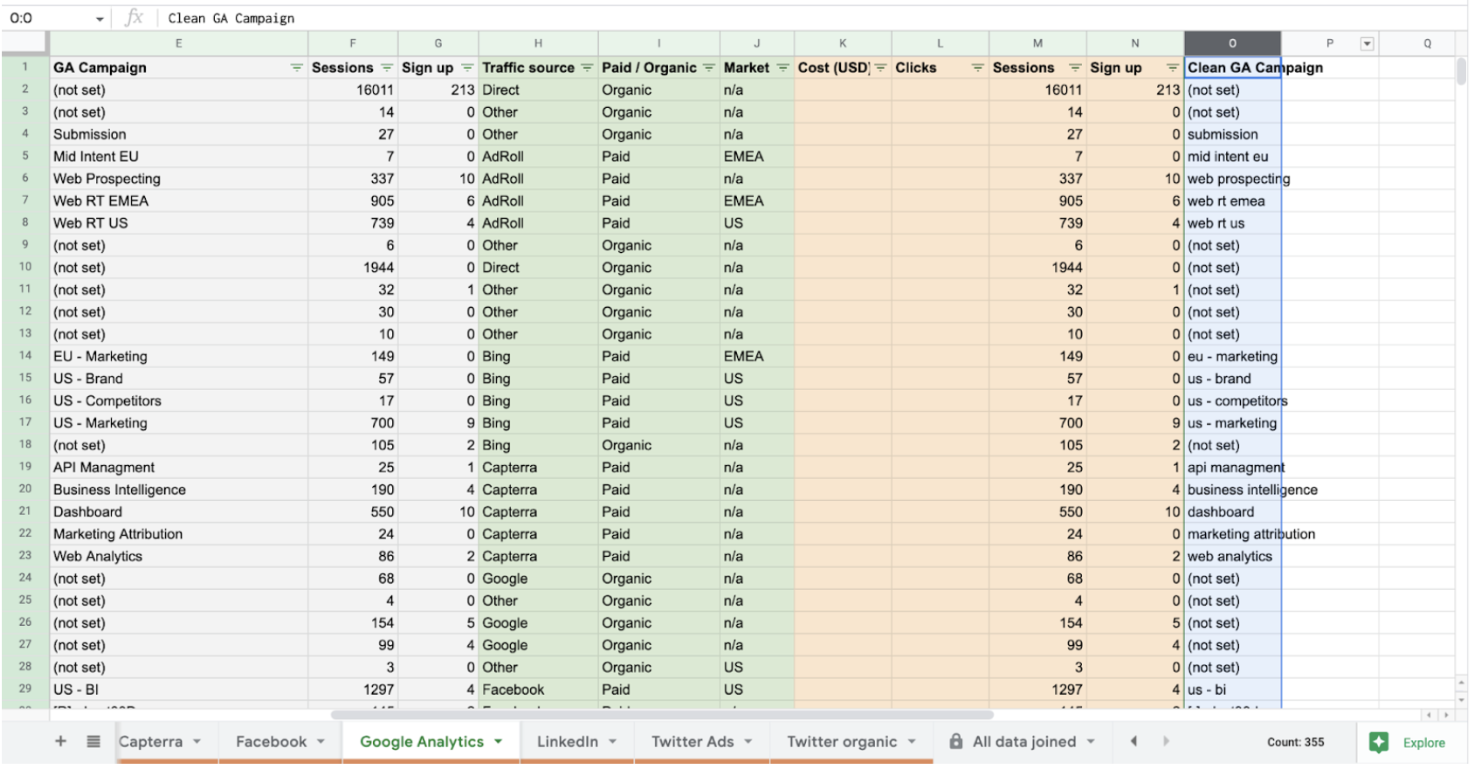
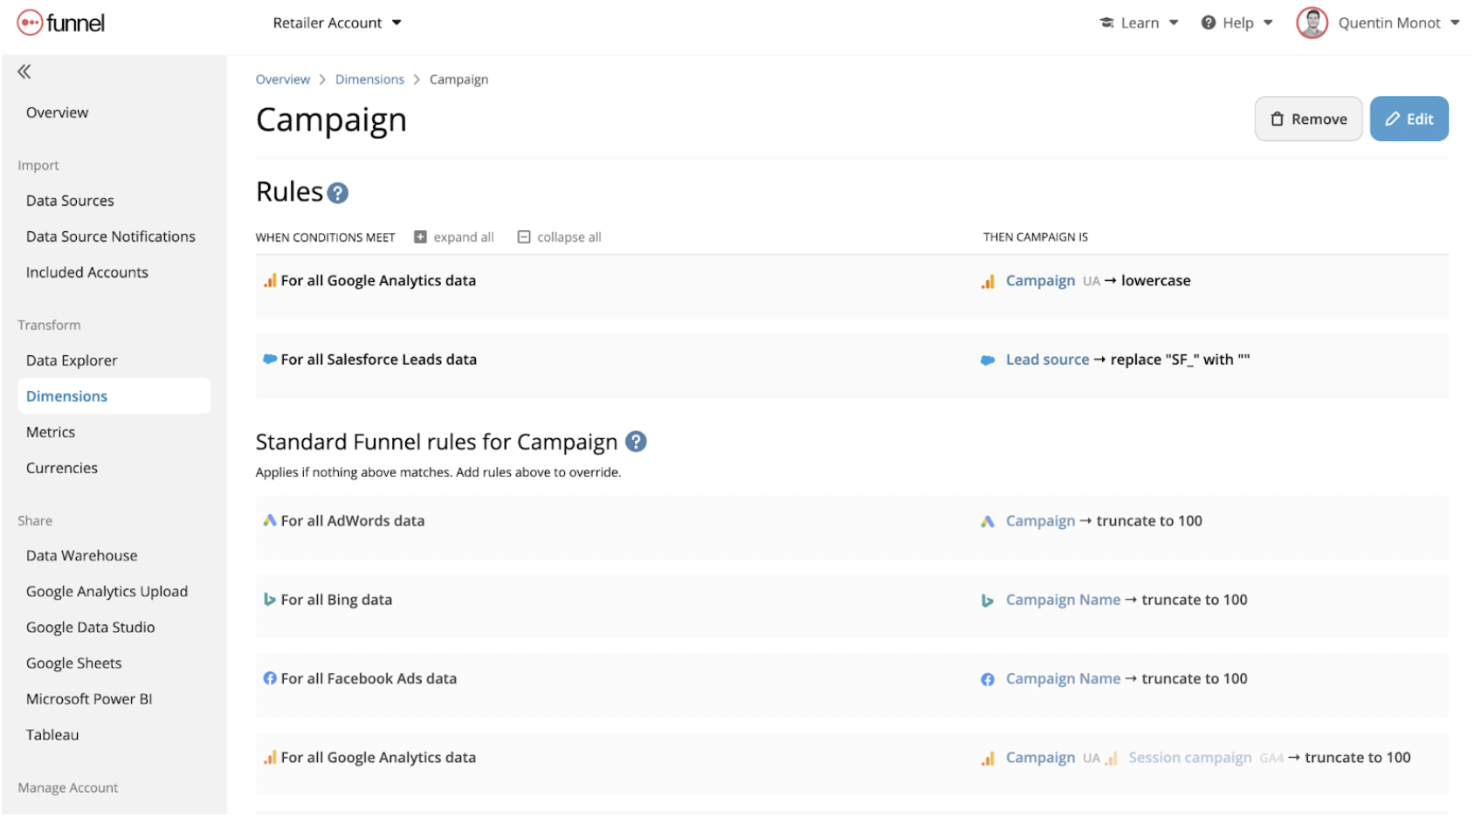
In this case, let’s pretend the campaigns from Google Analytics are all in capital letters, the campaigns from advertising are in lowercase, and the campaigns in Salesforce use “SF_” at the beginning of them. You will need to modify both fields in order to harmonize everything and begin to connect the dots.
In Google Sheets, you will then have to complexify your spreadsheet, creating additional “clean Campaign” columns.
Meanwhile, with Salesforce, you will need to use a SPLIT function.
In Funnel, the logic to convert data this way can be applied directly in the custom-created field. By manipulating the data, you can start making your data more harmonious.
Example 3: Enriching Data
The first two data transformation examples allow you to better utilize your data for reporting purposes. Once you’ve got your regular reporting down, you will be able to experiment more with your available data.
As a hypothetical e-commerce company, you may also want to analyze which market is the highest performing and which audiences are the most engaged with your social media.
In order to create those new dimensions, you can extract existing information from your other marketing data. For example, you could pull data from your campaign names, the market of each account, UTM parameters available in URLs, etc. We’ll show you what we mean below.
To start with, the campaign name has a structure that we can create new dimensions from summer-sale_UK_sneakers_display. If we want to enrich our data by creating a dimension for "market" that we can slice and dice our data by, we can extract the market from the campaign name.
In a Google Sheet, you can create a regex formula to extract the data. However, in Funnel you can extract the data with simple rules.
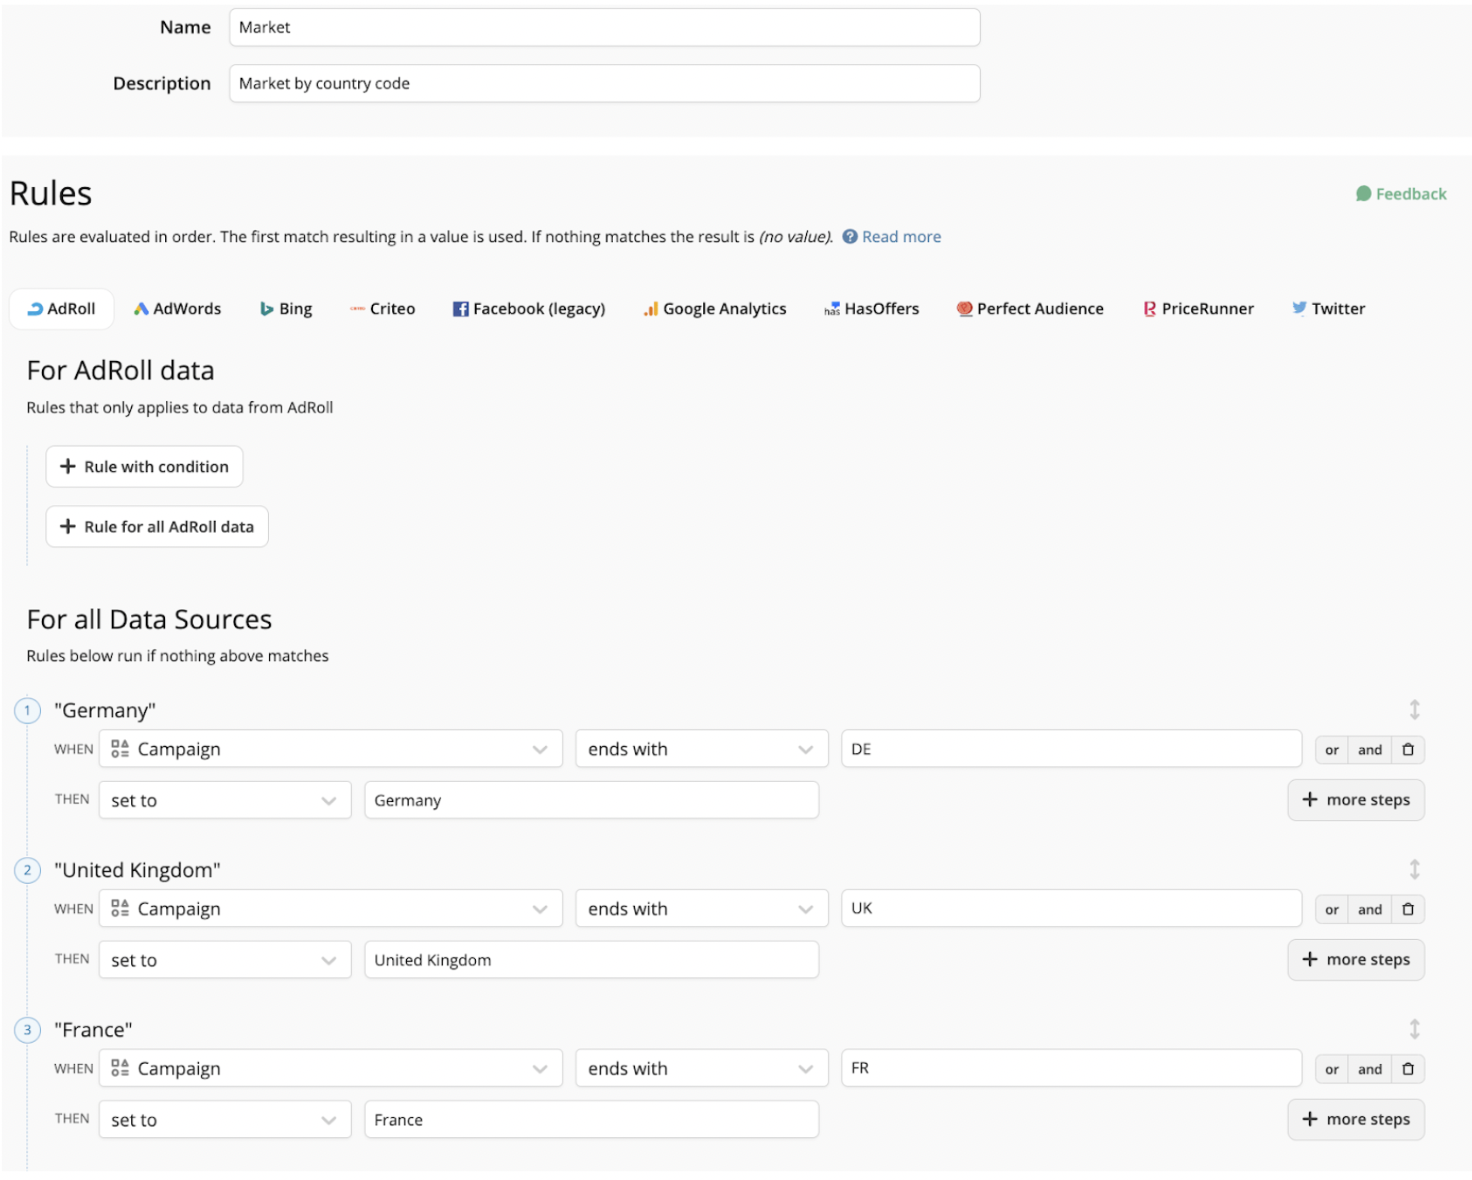
Conveniently, we can segment this particular data by market or region. In our case, we will categorize this as the UK market.
Funnel also allows you to use regex to extract information. You can check out our Funnel Tip about it here.
By enriching your dataset, you are using information contained in the existing data to specialize even more on how you look at your performance.
Final thoughts
We’ve highlighted just a few data transformation examples. As we mentioned, you can go pretty deep into the subject fairly quickly, but we hope these first few get you started on your journey. After all, understanding your marketing stack performance on a granular level will help you make better, more informed decisions later on.
Remember, these transformation capabilities are a necessity for cross-platform analysis. And as your marketing campaigns become more complex, so too will your data sets, and the transformation requirements.
There is a lot of documentation out there to help you understand and make sense of your data. You can even explore more about data mapping here.