
As the old saying goes, you can’t compare apples and oranges. Nor can you compare grandmothers and toads, cows and long johns, or honey and butter. Many cultures and languages have their own spin on why it’s incredibly difficult to compare two different things. When working with data, though, we have a solution for this age old conundrum: data mapping.
You see, data mapping allows us to adjust data from multiple sources so that they align. Think of it as turning those pesky oranges into apples.
What is data mapping?
Mapping data is the process of matching fields between two different data sets. Data maps are a crucial step when combining data, since different data sources could have different styles, formatting, or names for the same kinds of data.
Data Map 101: what do data maps do?
1) Move data into the right fields in a database or software
2) Correct and standardize data formats so it’s all the same
3) Prevent errors or data discrepancies

Let's take the Funnel office for instance. In Stockholm, our team uses a 24-hour clock. That means the Swedish teams set afternoon meetings at times like 14:00 or 16:15. Meanwhile, the colleagues in our Boston office would say those meetings are at 2 p.m. and 4:15 p.m.
Our calendar software needs to create data maps to ensure that our systems see those 2 different time formats as the same thing. 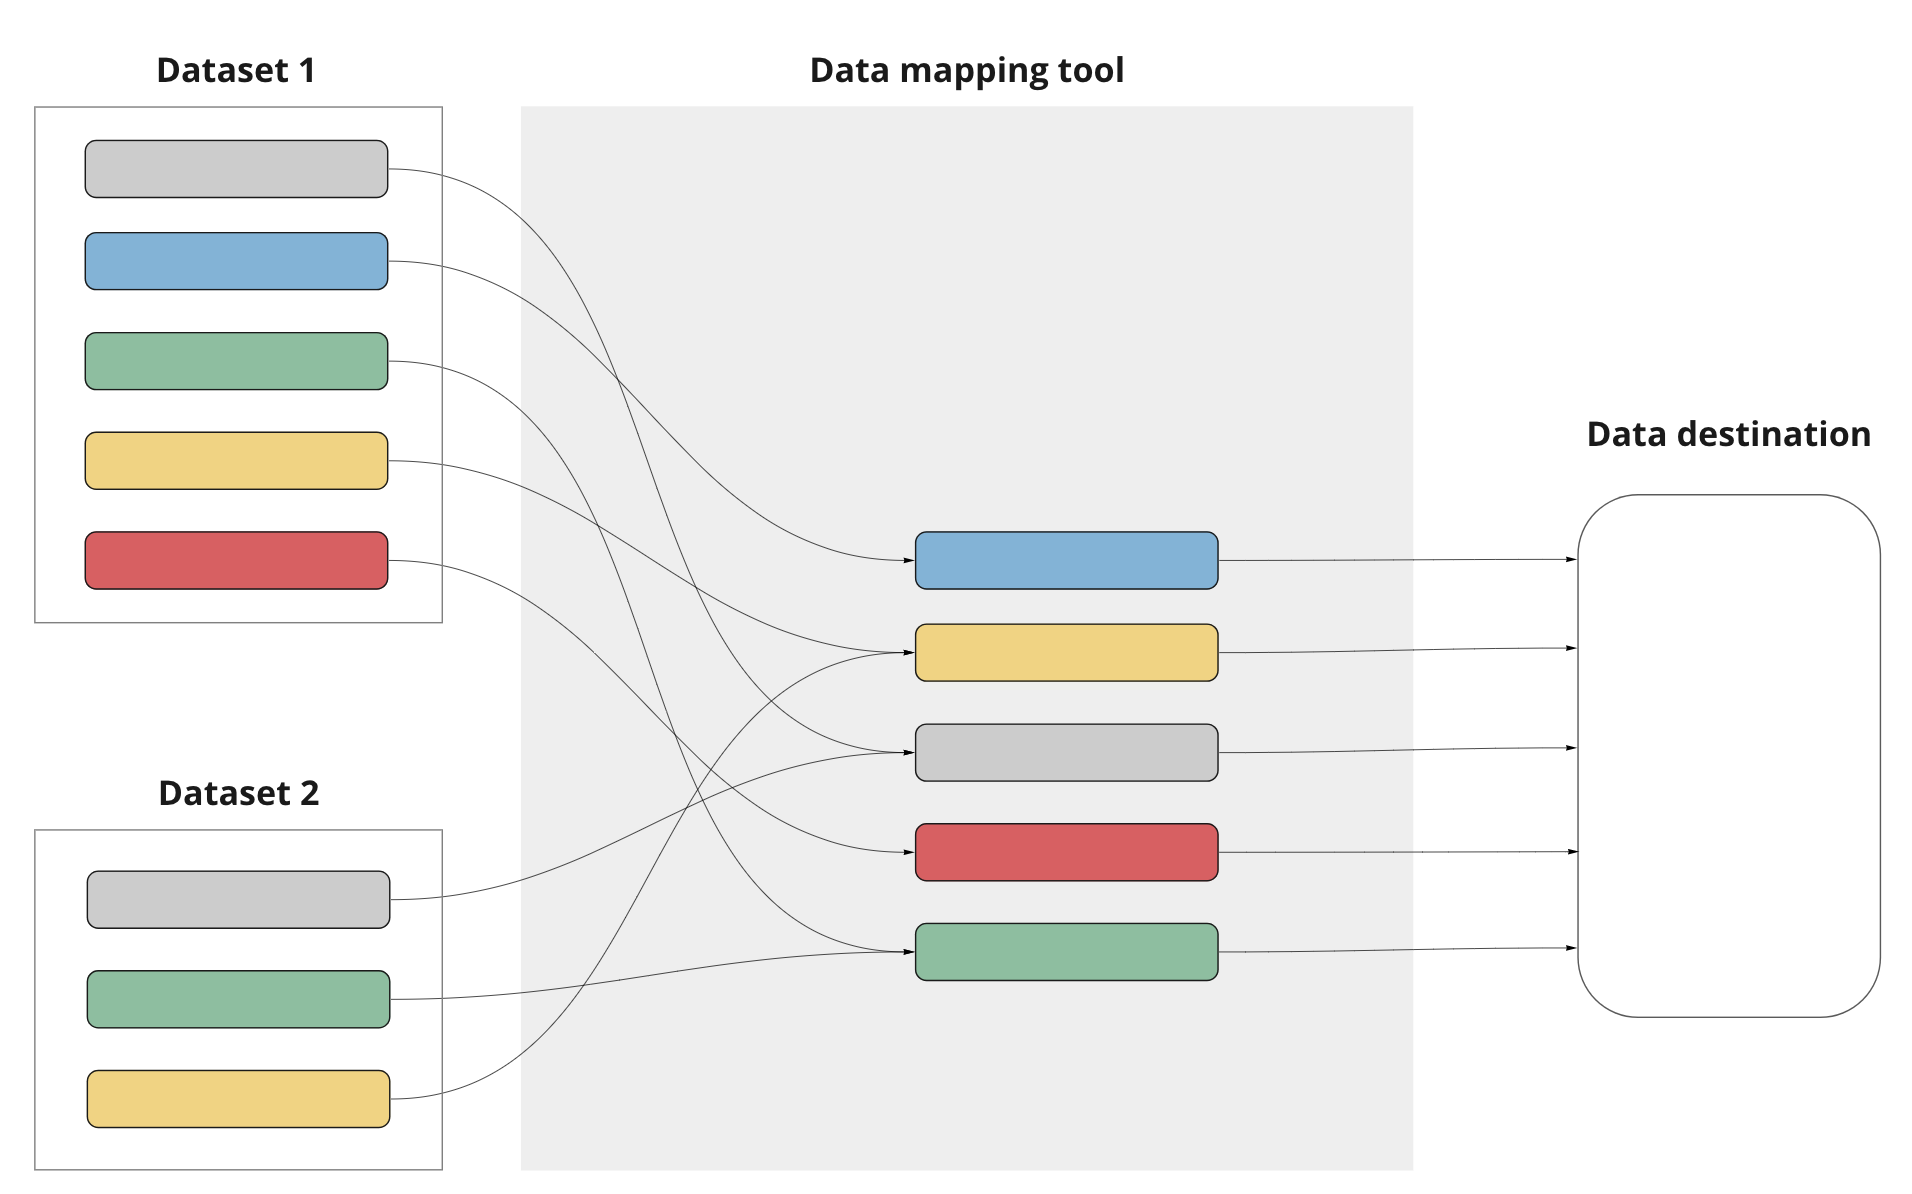
Data maps can be visualized like this.
Additionally, our Boston team members write the date differently than those in Stockholm. In the States, you might write 08/01/2022 (month/day/year) to represent the 1st of August. However, those in Sweden write 2022/08/01 (year/month/day) for the same date.
If you were to look at data from 1 August (or August 1), you would need to apply data mapping techniques to ensure that one of these styles is converted to the other.
Why is data mapping essential?
In addition to ensuring your team is working at the same time, data mapping is a crucial part of data management and handling processes. In fact, there are 4 key processes involved: data integration, migration, transformation, and warehousing.
Data integration
Data integration is the ongoing moving of data from one place (a data source) to another (a destination). Data mapping is a critical piece of integration since the map tells the data which fields to go into at the destination. Data integration is also known as 'data flow'.
Data migration
As the name implies, data migration is the process of moving data from a source to a destination. Unlike data integration though, which is ongoing, migration refers to a one-time transfer of data from the data source, to the destination. An example of a destination in this case, is a data warehouse or data transformation tool.
Transformation
In data transformation, you convert data from its source formatting to a format that fits its destination. Like in our time and date examples above, data transformation ensures that all styles are uniform. You can read more about data transformation on the blog here.
Warehousing
For those needing to pool data in a single large source, you may need to employ a data warehouse. For businesses using a data set that comes from multiple sources, data warehouses can be used as a central storage repository before its sent to be analyzed. Here, data mapping acts like a seating chart in the data warehouse, telling the incoming data where it should go. Here, data mapping acts as a sort of seating chart, telling any incoming data where it should go.

The data mapping process
What is the data mapping process?
The data mapping process can be broken down into 5 main steps:
1. Determine what needs to be mapped
You can’t hope to create a data map if you don’t know what you’re mapping. That’s why your very first step in the process is to identify the data models: values and fields that need to be mapped. When doing this, it’s important to think of what your main goals are. If you’re simply integrating or migrating, your data mapping process may be different (and less complex) than if you are transforming it.
2. Standardize your formats
Going back again to our time and date examples above, you need to make a decision as to what the master formatting will be. For the time, will the final formatting be Swedish or American? What about the format of the date? Now is the time to make those decisions.
3. Build the transformation rules and logic
Ok, here is the part that can be tricky if you're doing manual data mapping. You need to create some form of rules or logic (or data models and data flows) that will identify the data and make any required changes. Sometimes this step may require custom coding, but an automated data mapping solution could also do this heavy lifting in the background.
4. Run a test
Now that you have all of your rules and logic in place, it’s time to make sure it all works. Apply your data mapping to a small subset of your data to ensure that nothing breaks or transforms when it shouldn’t. If you’ve manually built your rules and logic in the last step, you’ll want the help of an experienced developer for this part.
5. Apply the data mapping
If your test went according to plan and everything is working as it should, it’s time to apply your data mapping to the reset of your data. If you're mapping for integration, be sure to keep an eye on the system to ensure that any changes to the data sources don’t affect your logic.
Selecting a smart data mapping tool
If you're feeling over your head with manual data mapping and are in the market for an automated data mapping tool that can handle your needs, you’ll want to select one that is best suited for your specific requirements. A good place to start is to make an honest assessment of your own experience and capabilities in handling data and raw code. Then, determine how much flexibility you’ll need.
From our perspective, there are 3 areas that you should keep in mind when looking for data mapping tools and comparing them.
1. Schedule and mapping automation
If you are intending to apply your data mapping frequently and regularly, you may want to think about a tool that can schedule and automate these functions for you. For instance, you may need to pull sales or marketing data from 3rd party platforms for weekly performance reporting. The more you can automate, the less manual data mapping is required.
2. Fluency in many languages
Fluency in programming languages, that is. Depending on your tech stack, you may need a tool that can “speak” in XML, JSON, Python, and more. Be sure to know the limitations of the software and yourself before making any final decisions.
3. Code or no code
If you’re an experienced developer or data scientist, you may be happy to roll up. Your sleeves and create custom code that supports your every desire. If you’re a digital marketer, though, you may want something that skips the hardcore programming part. Instead, you’ll want to opt for a code-free solution that allows you to create your data map in a graphical, drag-and-drop style, hiding all of the complex code behind the proverbial curtain.
Speaking of digital marketers…
Data mapping for marketing data
If you follow the Funnel blog (thank you, we see you) you most likely are NOT a super code savvy developer or data scientist. You’re a modern digital marketer trying to make sense of this whole data mapping thing so that you can use it in your day-to-day work.
Not to worry.
You probably already use data flows and data mapping without even realizing it. If you use cookies and other tracking technologies to target (and retarget) your audience, the underlying technology is actually a form of data mapping.
Then, when you need to collect your data, you’ll need to employ a form of data mapping before sending your data sets on to a visualization tool. When companies approach us early in their data growth journey, we often see them trying to map and transform data manually.
Want to continue learning about data? Also read our blog post on data models, with GA4 as an example of a data model.
This often involves collecting data in a massive Google Sheet with multiple tabs. Loads of rules are then applied throughout the sheet in order to ensure data conformity. While this approach is okay for those first starting out, it can quickly become unruly and lead to breakages.
What about automation?
When it comes to data mapping, automation offers a number of streamlined solutions. Automated data mapping comes into its own when managing large datasets or frequent updates, and actually increases in efficiency over time. Machine learning algorithms will automatically identify and map similar fields across data sources, while predefined templates seamlessly integrate platforms like Facebook Ads with Google Analytics. Whether you choose automated or semi-automated data mapping is down to your business’ needs.
Automated data mapping
There are a few ways to integrate automated data mapping: with machine learning algorithms, predefined templates and built-in integration. Automated data mapping is great for managing large data sets or frequent data updates super efficiently.
Machine learning algorithms
Machine learning is great for organizations with existing expertise in open-source models. The process uses algorithms to automatically identify and map similar fields across data sources. The best bit is that it learns your data patterns over time, and gets more accurate the longer it's used.
Pre-defined templates
With pre-defined templates, you can use data sources like social media ad platforms or tracking systems, for example, map Facebook Ads data to Google Analytics automatically and seamlessly.
Built-in integration
Funnel offers extensive built-in mapping rules for metrics and dimensions, which automatically update with new standard data sources. This makes it easier to map your advertising performance metrics and lets you choose custom rules for new data.
Semi-automated data mapping
Some organizations might opt for semi-automated data mapping over automated methods to get more precise control and flexibility in aligning data according to specific business logic or technical requirements.
Rule-based mapping
Custom mapping rules can be created based on your specific business logic. This could look like categorizing campaigns using certain strings in their names automatically, with the tools applying rules to each data row.
Custom SQL or scripting
For the more tech-savvy among us, writing custom SQL queries or scripts in your data warehouse gives real control over data mapping and transformation. This method adapts as new data types are introduced. And as custom approaches need more maintenance, you’ll need someone to keep an eye on the latest updates and take action when something needs attention.
Spreadsheet tools
Semi-automated data mapping can also mean using familiar tools like Google Sheets or Excel to manually create maps. Though it can be repetitive and potentially time-consuming for new data sets, it’s a straightforward solution for one-off cases.
Data mapping with Funnel
As your data offering becomes more mature and complex, you should really start thinking about moving to a stronger solution — something more akin to a data hub. That way, you can collect, organize, store, and share your marketing data.
Funnel is a data hub focussed on marketing data. It contains a data model that automates mapping data for widely used metrics and dimensions, such as consts, clicks and impressions. In practice, this means that after connecting the most popular data sources, Funnel will automatically match these data fields.
Here's an example: if data from one source talks about 'spend' and another about 'costs', Funnel will automatically show you your total marketing spend.
Frequently asked questions
How does data mapping handle discrepancies in data quality across different sources?
Data mapping deals with discrepancies in data quality by employing validation rules and quality checks that identify and correct errors or inconsistencies before or during the data mapping process. This ensures that the data integrated into the target system is accurate and reliable.
What are the most common challenges faced during the data mapping process and how to overcome them?
The most common challenges when creating a data map include handling complex data structures, managing large volumes of data, ensuring data quality, and dealing with frequent changes in source systems. Overcoming these challenges often involves using sophisticated data mapping tools, continuous monitoring, and updating mapping logic to adapt to new requirements.
Can data mapping be effectively used for predictive analytics, and if so, how?
Data mapping can be an integral part of predictive analytics by ensuring that the data used for forecasting is accurately mapped and integrated from various sources. This ensures that predictive models have access to high-quality, relevant data, which is crucial for accurate predictions and effective decision-making.