Instagram is one of the biggest platforms with billions of active users. As high as 71% of businesses use it to reach and attract potential customers. It’s no wonder because over 80% of customers agree they use Instagram before deciding to purchase a service or a product.
If you’re here, you’re likely already using Instagram for your business. However, as the social media network is saturated with users and content creators, you’ll have to pay close attention to analytics to keep growing organically.
This article will examine different types of Instagram analytics and important metrics to track. Before we get into details, let’s look at how to access Instagram analytics first.
![]()
Different analytics to explore
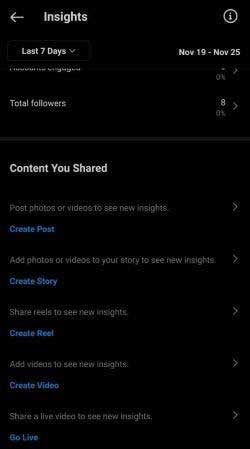
As you already might be familiar with, Instagram has expanded the types of content you can create. It started as a platform that supported image and video posts but then adapted and introduced new features to stay ahead of competitors.
Therefore, when you get to the Insights section of the app, you’ll see analytics for:
-
Posts
-
Stories
-
Reels
-
Videos
-
Live Videos
A closer look will reveal more details about your Instagram follower demographics. You’ll be able to make informed decisions that deliver steady organic growth. Don’t forget to switch your Instagram account to a business account, you’ll then be able to explore these metrics.
Perform a thorough analysis of each of these to better understand what kind of posts are engaging. Replicate similar ones in the future to get more traction. Here’s a closer look at each of these, and how they are relevant for your Instagram’s growth.
Post
When you head over to the Insights, you’ll be able to filter out which posts you want to explore, only videos, photos, or carousel posts.
You can also explore how posts are performing individually. Take a look at Engagement, Impressions from Home, and Hashtags.
-
Engagement — Posts with higher engagement rates reach more audiences. The platform’s algorithm considers engagement a serious factor when showing posts in other peoples’ feeds. As Instagram wants its users happy and in the app, the algorithm handpicks posts with more interactions. The average engagement rate now sits at 0.83% for business profiles. So don’t worry if your figures are under 1%, even though it sounds low, it’s normal.
-
Hashtags — Pay close attention to the hashtag performance, as higher reach numbers show that you’re using the right hashtags for your business. If you notice a low impression count, it’s better to mix and monitor impression counts with future posts.
-
Impressions from Home — These are impressions based on your followers’ feeds. This number should be high, meaning that most of the followers have seen your post.
Aside from these stats, you’ll also see the number of likes, saves, interactions, comments, shares, and other similar metrics.
Why is all this important? Your goal is to leverage the data and deduce which types of posts performed well. Recreate similar posts and monitor engagement.
For example, if you look at Starbucks’ Instagram profile, you’ll notice that all their posts are similar. Product photos teasing people with various coffee flavors work for them. Use analytics to find the types of posts that work for you.
Story
 Instagram’s Stories are an answer to the growing popularity of Snapchat from a couple of years ago. They were a great addition to the platform, as you get to interact with your audience by creating polls, asking questions, or simply sharing a different type of content.
Even though these posts disappear after 24 hours, you still get to see analytics and see how different stories performed.
Important things to note are navigation stats such as:
-
Exited — When it comes to Stories, the number of exits is an important metric. If you see that 50 people have seen your story, but 30 have exited, you shouldn’t share such stories in the future. They are irrelevant for your audience. On the other hand, if it’s only 1-5 people, you’ve got nothing to worry about.
-
Completion rate — Completion rate is not available in the app. It’s a metric that you calculate on your own. If you share multiple stories, compare the number of viewers of the first and the last slide. That’s how you calculate the completion rate. The standard for business profiles is 87%.
Dannijo is an excellent example of creating stories relevant to the brand. The brand uses stories for advertising discounts and features fantastic products, but it also keeps in touch with its audience by congratulating holidays.
Reel
 Instagram Reels are the latest addition to the post types. It replaced IGTV, which became a separate app for those who enjoy that format. Much like Stories and Snapchat, Reels are an answer to the immense popularity of TikTok. It’s a short video format that appears in Instagram users’ feeds.
Important Reels metrics are:
-
The number of plays — The number of plays shows how entertaining the video is. It’s a great way to see how many times people rewatched the video. If the number exceeds the number of accounts reached, it means that some people have viewed the video multiple times. Repeat creating such content.
-
Accounts reached — This figure shows the number of unique viewers of your video.
-
Likes, comments, shares, and saves — Like other format types, these metrics show users’ engagement with your Reels. Use the data to see which kinds of videos received positive feedback from your audience.
Many brands have started using Reels to share entertaining videos with their followers. Look at Pepsi - one of their Reels comically incorporates their product in the current work from home trend due to the global pandemics. The video looks amateurish, which is typical for such a video format. The purpose is to put a smile on the viewer’s face and not look polished.
Video
The Video section is a single place where you can see insights for all types of video content on your Instagram profile. Analyze stats such as percentage of videos watched, likes, comments, shares, views, and other video metrics. They tell a story about your video content strategy.
You can go back up to two years and examine your video performance. Look for growth trends over time and examine the most successful videos. Use them as a reference for your next piece of content to increase its chances of getting more views and growing organically.
Live Videos
Last but not least, Live Videos have been an important part of the platform for years. The analytics became available when the Reels feature launched in May 2021. Live video analytics shows the following metrics:
-
Peak concurrent viewers — The number of concurrent viewers displays the maximum number of viewers watching you live simultaneously. Ensure that it steadily grows as your follower count keeps going up.
-
Live interactions — Live interactions show how alive your stream is. If your content is engaging, you should have a decent amount of comments from your viewers. If you notice low numbers here, adjust your content to make it more inviting. (Ask for feedback from the audience and run Q&As streams)
-
Accounts reached — This metric stands for the number of unique viewers of your live stream. Watch the progress of this metric over time, as it shows how many people come across and watch your stream organically. It needs to grow over time steadily.
Keep track of how these metrics change from one live video to another. Performance of live videos will vary from one stream to another. Experiment with different types of live streams and see how they perform.
Analyze the results and keep creating content
If you want to enrich your analytics with data, keep creating content. It’s the only way to try out different content strategies and see what works and what doesn’t. You can’t see the best times to post every day unless you make a piece of content every day.
A smart approach is repurposing content for different media formats. For example, you could reuse an interaction from a live video in a post later.
Once you turn regular posting into a habit, you need to closely monitor your audience's behavior. Did your last post get as much engagement as the previous one? Are you posting at the right time when most of your followers are awake?
These are all the things you’ll be able to figure out from your analytics. When you capture patterns that bring great organic results, apply the same recipe to your future posts and watch your organic traffic slowly grow.
Concluding thoughts
Social media has an important impact on your overall marketing strategy. That’s why exploring Instagram analytics is crucial for your growth. A rank-checking software is a helpful addition that’ll help you monitor the impact of Instagram marketing on your ranking with search engines.
The overall marketing data is beneficial as marketing performance plays an essential role in calculating revenue projections. Therefore, carefully analyze the Instagram performance data to ensure continuous organic growth.
Now that you’re aware of the key metrics to monitor, it’s time to consistently keep track of them to keep growing your organic audience. Try to remain as creative as possible and experiment with different post types.
About the author
Andrii Kalashnyk is the CMO at trendHERO with 9+ years of experience in digital marketing. He started out as an email marketing manager, moving on to copywriting - and for the last three years has been focused on analytics and influencer discovery.