
In Arthur Conan Doyle's 1887 book 'A Study in Scarlet,' iconic detective Sherlock Holmes makes a comment that still applies today: "It is a capital mistake to theorize before one has data."
While Holmes was talking about crime, we can also apply his words to business management. Data is an invaluable resource that can help businesses build strong revenue forecasts that drive the brand forward. Naturally, businesses build their best forecasts on historical sales data.
But there's a problem with this approach. If you're a small business, you may have limited historical data to use. So what should you do?
We suggest you keep reading. In this article, you'll learn how to build a strong revenue forecast using the marketing and short-term sales data you already have - as well as everything you need to know to maximize your forecast's value long term.
Let's get started.
What is revenue forecasting?
Before we dive into the art of building a revenue forecast, let's define some of the terms used in this article.
A 'revenue forecast' is a projection of all of your business's future sales. This includes sales from every product and service you sell, which people sometimes call 'units' in the context of a sales forecast.
During the sales forecasting process, you will take the data you have on your unit performance and use it to predict your future sales performance. This data includes marketing metrics and short-term sales figures like:
- Average spend per customer which you can calculate by adding all your customer transactions together and dividing them by the number of customers (i.e. ($54 + $30 + $20)/3 customers = $34.6).
- Cost per conversion which you can calculate by dividing your costs by the number of conversions you made (i.e., if it costs $500 to get 100 sales, your cost per conversion is $5).
- Average daily sales conversions which you can calculate by adding your daily sales conversions together and dividing it by the number of days you're measuring (i.e., if your sales were $750 for Monday, $650 for Tuesday, and $540 for Wednesday, your average is $646.6).
- Daily revenue which you can calculate by adding together all the transactions for a single day.
- Conversion Rate which you can calculate with the formula '(number of conversions/number of visitors) x 100' (i.e., If you had 20 conversions and 200 visitors, your conversion rate is 10%).
- Daily website/ store visitor numbers = which you can calculate by recording the number of people who visit your store or website daily.
Note: While many businesses have extra revenue streams like rent revenue, land sale revenue, and intellectual property royalties, you shouldn't include these income streams in your sales revenue projections (as the extra income will skew your sales projections and give you misleading results). See also:
What should your revenue forecast include?
So what is the scope of a good sales forecast? Ideally, you want to create two sales forecasts for your business: a 12-month forecast and a 3 - 5 year forecast.
The 12-month forecast is your most accurate projection, as the further into the future you forecast, the less accurate your predictions will be. You should use your 12-month forecast to guide your marketing campaigns, operations spending, inventory, and staffing needs.
The 3 - 5 year forecast is a 'big picture' forecast. You should use it to guide the overall direction of your company, including which markets you target and how you innovate your products and services.
You can create your 12-month forecast and 3 - 5 year forecast using the instructions in the 'Marketing-linked strategies to create revenue projection reports' section. The same steps apply to both forecasts.
Why is a revenue projection important?
Projecting your revenue figures is crucial for small businesses, as your forecasts will help you create key oversight documents like your profit and loss statement, cash flow statement, and balance sheet. You can use these figures to inform your budget and financial decisions (as well as appeal to new investors).
Projecting your revenue will also help you manage the operations side of your business in the coming months, as it can help you to:
- Predict your staffing needs so you can hire new talent where necessary
- Decide how to optimize your next sales promotion strategy
- Predict your inventory needs so you can stock up on products that sell quickly
- Generate marketing performance reports
- Set short-term and long-term financial goals for the business
Revenue projections can also inform your business decisions. For example, if your projections show that your business makes most of its revenue from three products, you could restrict your product range and save on operations expenses.
Alternatively, you can use revenue projections in combination with your marketing campaigns. For example, by assessing your cross-channel marketing strategies and seeing the impact each channel drives on revenue, you can make better-informed decisions on which to invest in to maximize conversions.
Find out more: What is performance marketing?
Marketing-linked strategies to create revenue projection reports
Now that you know what revenue projection is and how it will benefit you, you're ready to learn how to create revenue projections for your business. This section will outline four projection methods you can use and what you should use each projection method for.
Let's get started!
1. The extrapolation method
The extrapolation method is suitable for businesses that want daily revenue projections based on averages. Suppose there isn't a high degree of deviation in your daily revenue and spending figures. In that case, this is the perfect method for your business (as you won't have to worry about outliers throwing off your average). The extrapolation method is also great for creating budgets and financial planning, as it forecasts your sales acquisition costs.
To carry out the extrapolation method, you need three pieces of data:
- Your average spend per customer
- Your daily cost per conversion
- Your average daily sales conversions (or projections)
Then, you need to take these three pieces of data and log them into a spreadsheet that looks like this:
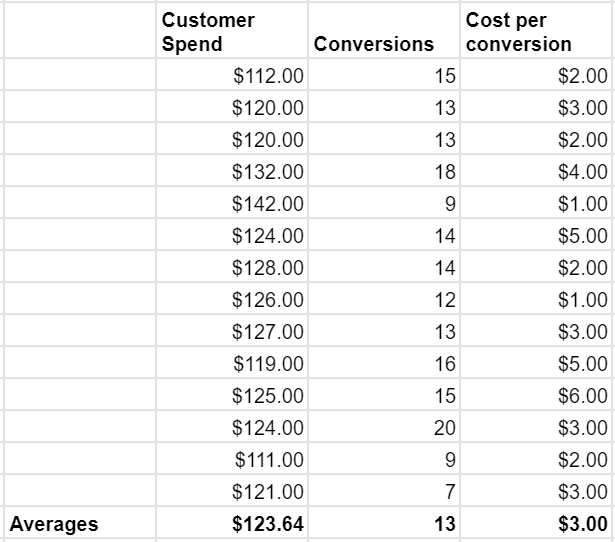
From there, you need to calculate the mean figure for your 'customer spend', 'conversions,' and 'cost per conversion' categories. You can calculate the mean by adding all your figures together and dividing them by the total number of figures (i.e. '(45 + 34 + 28)/3 = 35.6').
Once you have your average 'customer spend,' 'conversions,' and 'cost per conversion' figures, simply use these averages to predict your daily figures for the rest of the period. For example, if your customers spend an average of $123.64 each and you get an average of 13 daily conversions, your expected revenue figure over the next twelve months is $586,671.8.
2. The efficient frontier method
The efficient frontier method involves using scatterplots to predict your future revenue. This method is best suited to businesses looking to map long-term revenue trends that will guide the company's direction. It's also great for businesses looking to appeal to new investors.
To carry out the efficient frontier method, you need one key piece of data: your daily revenue figures. To get your projected revenue, you need to put your key figures in a Google Sheets or Excel table like this:
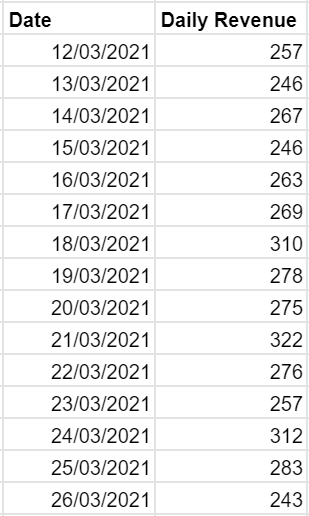
Once you have your table, create a scatter plot by selecting the cells in your table, clicking 'chart,' and selecting 'scatterplot.' You can extrapolate your future sales figures using the trend line your chart provides.
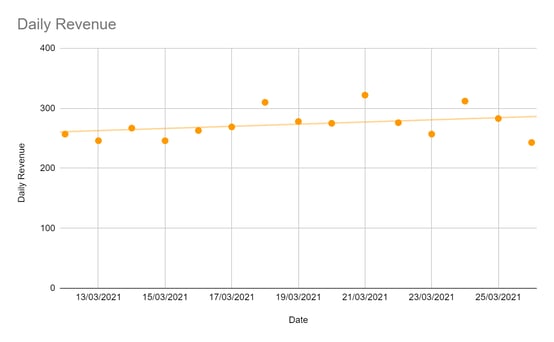
Once you start accumulating a lot of data, doing this work manually can start to become highly cumbersome. What’s more, real-world patterns are much harder to see than the tidy example above. With a financial data reporting and forecasting tool, you can apply automated data standardization processes and sophisticated projection visualizations to your Excel reports.
3. The live forecast method
The live forecast method is a sales forecasting project that compares a business's predicted and actual revenue figures to generate accurate sales projections. This method is best suited for businesses that need to monitor month-on-month revenue figures as they expand their operations or enter a new market.
To carry out the live forecast method, you need:
- Your average daily sales conversions (or projections)
- Your conversion rate
- Your daily revenue
- Your average cost per conversion
Next, you simply create a forecast using either the extrapolation or efficient frontier methods. Then, you need to set up a sales performance dashboard to track your sales for the next month.
At the end of that month, take your actual sales figures from the data dashboard and compare them to your projections. This will tell you how you measure up to your goals (as well as tell you how accurate your forecast is).
4. The uncertainty method
The uncertainty method is a sales forecasting method that allows you to predict your sales forecast in a range that includes minimum and maximum projected sales figures. This makes it perfect for businesses that want projections that account for market fluctuation. It's also great for budgeting.
To carry out this method, you need:
- Your daily conversion rates
- Your daily visitor numbers (either in-store or online)
- Your average spend per customer
When you carry out this method, you need to do two calculations. First, you need to take your minimum conversion rate and multiply it by your smallest daily visitor number (i.e., 0.5 x 100 = 50 conversions). Second, take your maximum conversion rate and multiply it by your largest daily visitor number (i.e., 0.1 x 750 = 75 conversions).
Then, you need to multiply your maximum and minimum figures by your average spend per customer and extrapolate it for the rest of the period.
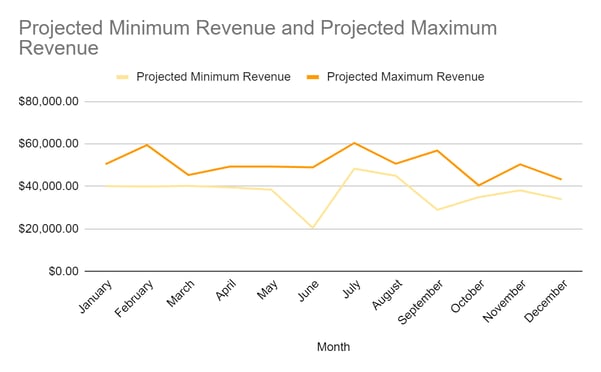
For example, if your minimum figure was 50, your maximum figure was 75, and your average spend per customer was $12.5, your projected annual revenue will fall between $228,125 and $342.187.5.
Factors affecting your revenue projections
During the revenue forecasting process, you need to keep one critical thing in mind: these are just projections. Unfortunately, there are many types of external factors that can influence your final revenue figures. This includes:
Market conditions
Market conditions are industry-wide factors that influence your sales by altering your customer's purchasing behavior. Common market conditions include:
- Market growth or shrinkage
- Increases and decreases in product demand
- The popularity of competing products
- An influx of new competition
- Labor or material shortages
- Market-disrupting competitors (like Uber in the Taxi industry)
As market conditions are out of your company's control, there is no perfect way to account for them in your revenue projection figures.
Seasonal demand
Seasonal demand is the fluctuation of sales due to external factors like holidays, local events, weather, tourism numbers, cultural celebrations, and jurisdiction-wide events like elections.
Understanding how seasonal demand impacts your sales is crucial in projecting revenue accurately. You can account for seasonal demand by extrapolating your revenue figures from data gathered over long periods (i.e., months, quarters, and years) and using the uncertainty method that gives you a revenue range.
Regulation and local laws
Local laws and regulation changes can impact your business by influencing your supply chain, unit pricing, customer behavior, or business direction. Common regulatory changes include alterations to labor laws, sales taxes, product standards (like GMP guidelines), data collection laws (like GDPR), and import and export laws.
The best way to account for regulations in your sales forecasts is to anticipate how new regulations and laws will impact your business before the government signs them into law. As regulation changes are gradual, you can learn about them through the news, regular media monitoring, or by joining industry groups.
Crises
Crises can impact your business by interrupting your supply chain and sales practices. Common crises include natural disasters like floods, earthquakes, fires, pandemics, tornados, extreme weather.
There is no way to anticipate crises in your sales forecasts. Still, you should consider the potential issues in your area and how they would impact your finances when conducting business planning.
Why your business needs sales forecasting
Data is a precious resource your business can't afford to waste. If you use your data to create accurate revenue reports, you can make evidence-based business decisions. But fail to use your data, and you'll need to make tough decisions in the dark.
We recommend the extrapolation, efficient frontier, live forecasting, and uncertainty methods as revenue projection methods. However, the best method for your business will depend on what you need the data for.
Ultimately, businesses that get value out of their revenue projections have one thing in common: they revisit their projections often and apply them to every aspect of their business. With that wisdom in mind, you're ready to build your projection.