-
 Written by János Moldvay
János Moldvay is Funnel's VP of Measurement. He has more than 20 years of experience working in the marketing data and measurement space.
With cookie deprecation and stricter tracking regulations, it's becoming more challenging to measure the impact of marketing activities and their contribution to revenue. To add to this, companies now hold marketers more accountable for measuring the impact of their campaigns, placing a significant amount of pressure on them to produce results.
To meet these challenges, unified marketing measurement (UMM) is the solution. UMM is a powerful approach that allows marketers to analyze the full-circle impact of their marketing mix and make real-time adjustments to their campaigns. By applying statistical models and providing combined insights into both the overall marketing mix and the customer journey, UMM provides a more complete and accurate picture of marketing performance.
But what exactly is UMM? Essentially, it comprises two components: marketing mix modeling and multi-touch attribution. By understanding how these two components work together, marketers can gain a better understanding of the benefits of UMM and how it can help improve marketing ROI.
In this article, we will dive into marketing mix modeling with aggregated data, multi-touch attribution and the role of user-level data, and the combination of both; unified marketing measurement. We will explore the power of UMM for marketers and how accessing a complete, holistic view of all marketing activities is essential to combating the ever growing challenges associated with marketing measurement.
So, whether you're struggling to measure the impact of your marketing activities, or simply looking to optimize your marketing budget, UMM could be the solution you've been looking for.
Marketing mix modeling & aggregated data
Measure impact from offline channels with marketing mix modeling
Marketing mix modeling (MMM) is a powerful statistical method used to measure the impact of marketing activities on revenue. Since the 1980s, top companies like Procter & Gamble have been using MMM and have proven to be effective in quantifying the impact of marketing on a business's bottom line.
MMM collects data from a wide range of sources, both online and offline, and aggregates it to provide a macro-level view of marketing performance. This data can include everything from TV activities and paid search campaigns to print ads, digital out of home (DOOH), mailings, and social media impressions.
One of the biggest advantages of MMM is that it does not require the collection of personal identifiable information (PII). This is especially important in today's regulatory environment, where data privacy is a significant concern. With MMM, marketers can obtain valuable insights into the performance of their marketing mix without the need for consent management.
In short, MMM is a valuable tool for businesses looking to measure the impact of their marketing activities and make informed decisions about where to invest their marketing dollars. By providing a macro-level view of marketing performance and without requiring the collection of personal identifiable information, MMM can help businesses optimize their marketing mix and drive revenue growth.
MMM & the regression analysis
Once data is collected by MMM, it employs a powerful statistical technique known as regression analysis, specifically a time series regression. This approach uses input variables to predict the outcome of a target variable while factoring in control variables.
So, let’s break this down a little. The regression analysis utilized in MMM works with time-series data, which simply means data is collected and recorded over time. For instance, this data might include sales data for today, yesterday, and the days before, resulting in thousands of data points. By analyzing this time-series data, MMM can provide a more complete and accurate picture of the impact of marketing activities on revenue.
With some additional effort, the algorithm used in MMM is even able to go beyond simply identifying the impact of a given activity on sales. It can also learn how that impact evolves, taking into account the impact of older ads. This is known as the adstock effect. Accounting for these factors, MMM allows marketers access to a more nuanced and sophisticated understanding of the relationship between marketing activities and revenue.
Breaking down the data and variables used in MMM
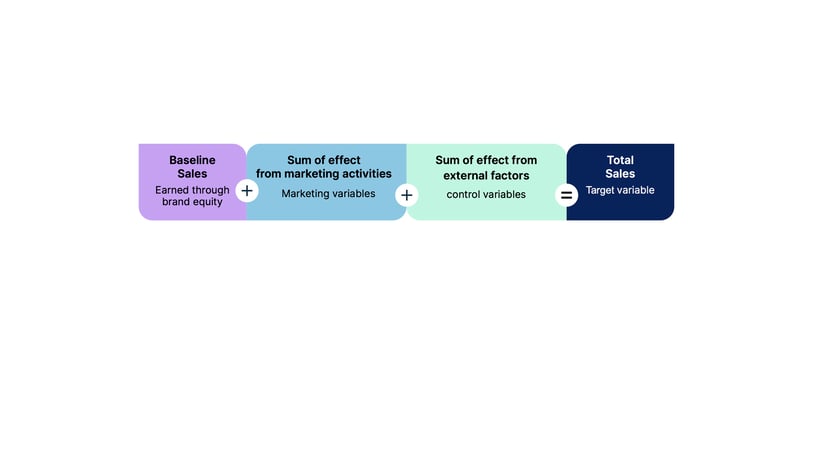
In MMM, the collected data is divided into two parts. The first part consists of control variables, such as price or placement, as well as external factors like weather and seasonality. It's important to consider these factors, as they can have an impact on sales in addition to marketing activities.
The second part of the data comprises the summed-up marketing activities, such as clicks on an ad banner or sent emails. To make the model even more precise, the adstock effect is factored into these data points.
The data points from both parts are then modeled on a target variable, which is typically a desired output like conversions, sales, or revenue.
Here is a look at a simplified version of the equation:

Analysis of marketing impact with MMM
Once data is calculated, many challenging questions for marketers can be answered. One question on the minds of many marketers is “What incremental impact are our marketing activities having on sales?”
This is an important question as incrementality indicates how many potential conversions were generated through additional marketing efforts and spending. However, it’s essential to consider that not all marketing activities will linearly impact the conversion rate. If we look at TV ads for example, normally a point of saturation will arrive sooner or later. Running ever more TV ads does not necessarily mean more sales for your company.
This law of diminishing returns is accounted for by MMM and is incredibly helpful in understanding how your current marketing mix is performing. Not only this, but it is also helpful in gaining insight into where to put your marketing resources next and which channels to explore further.
In essence, MMM is an indispensable tool for marketers who want to increase overall ROI and make data-driven decisions about where to allocate their marketing resources. By providing a nuanced and comprehensive view of the relationship between marketing activities and sales, MMM empowers marketers to make strategic decisions that yield maximum impact.
Multi-touch attribution & user-level data
What exactly is multi-touch attribution (MTA)?
As discussed, while MMM is designed to work with aggregated data to measure incrementality and predict sales on a macro level, MTA takes a more granular approach.
MTA, on the other hand, collects user-level data from digital online sources, with GDPR-compliant consent, resulting in millions of data points. Every touch-point along the customer journey is captured, including social ad clicks, paid search clicks, onsite events such as add-to-carts and more.
MTA distinguishes between converting and non-converting customer journeys, providing insight into the impact of every single touchpoint on conversion probability, resulting in a calculated attribution weight.
In simpler terms, MTA helps you understand the likelihood of a customer converting when they see your Facebook ad versus when they don't, and how this likelihood changes with other touchpoints the customer has had with your brand.
MTA & the classification model
MTA runs in contrast to MMM not on a regression but on a classification model which is a different statistical method used to analyze data. It does not factor in seasonality or other external factors nor does it consider offline sources. As a result of this gap in data, the outcome is a micro view of marketing activities and their impact on sales.
Later on, we'll explore how UMM can help reconcile the differences between MMM and MTA and shed light on the effects of both. But for now, let's focus on the classification method used in MTA, which distinguishes between converting and non-converting customer journeys. The MTA algorithm uses subtraction to deduce the impact of each touchpoint on the conversion probability.
To illustrate this, imagine a scenario where a person sees your Facebook ad, searches for your brand on Google, clicks on a paid search ad, browses your website, adds an item to their cart, leaves and later returns after clicking on a retargeting ad to finally convert. Another person might follow the same route but without seeing the retargeting ad. By comparing these two scenarios, MTA can determine the precise impact of the retargeting ad on the conversion probability.
Applying Machine Learning in MTA
Multi-touch attribution (MTA) utilizes the power of machine learning to detect recurring patterns in sequential events, such as the order of touchpoints in a customer's journey. Specifically, Funnel's MTA employs an algorithm called long-short-term-memory (LSTM), which is widely used not only in marketing but in a variety of machine-learning applications, including text suggestions, translation services, and more.
So, as mentioned, LSTM is a machine learning algorithm that adopts a general approach of feeding information into sequential loops and allows it to persist. This technique enables LSTM to capture and incorporate events that took place a long time ago, as well as more recent, short-term events, hence the name long-short-term-Memory.
By bridging the time gap between touch points in a customer's journey, LSTM can make accurate predictions by applying “if-then” rules. These rules enable the algorithm to decide how long to remember certain data related to a touchpoint, for example, a click on a display ad.
Of course, for now, this is simply put, but imagine this model being used across twenty marketing campaigns, across 5 different channels in 5 countries. If this scenario were true, there would be 1,000 different outcomes to consider!
Hold-out sample ensures validity
To ensure the accuracy, reliability, and validity of results, a hold-out sample is employed. This approach involves splitting the available data into two portions, e.g. with only 70% of the data points fed into the LSTM model, while the remaining 30% is set aside for testing purposes.
The model is trained using the above-mentioned 70% of data points, and once fully developed, the remaining 30% of the data that was set aside is then used to test the model. The predictions generated by the model are then compared to the actual and raw data to assess how closely they match. This method allows for a thorough evaluation of the model's performance, helping to ensure that the predictions generated are robust and accurate.
After the validation process is complete, the next step involves calculating the attribution weights, which show the impact of each touchpoint on the conversion probability. This is done through a subtraction process that results in a weight factor between 0 and 1.
Downfalls of MMM & MTA
Evidently, MTA is beneficial when understanding the impact of a single activity on a customer journey. However, it does come with downfalls that are too significant to dismiss. MTA does not consider external factors like seasonality, weather or pricing. It also doesn’t take brand effects or offline marketing into account, which can be detrimental to the impact on your revenue.
In an ideal world, marketers would have access to both a macro and micro view of marketing activities to make informed, data-driven decisions. This is exactly what UMM aims to bring to the table. With a combination of both MMM and MTA, UMM allows marketers to have a 360-degree view of all marketing-related data. In the next section, we are going to take a closer look at UMM and just how it can be a game changer for any marketer that has objectives around increasing KPIs through marketing efforts.
Unified marketing measurement lives on the intersect between MMM and MTA
How unified marketing measurement combines insights from MMM and MTA
The beauty of UMM is its ability to combine input from aggregated data collected through marketing mix modeling (MMM), such as daily TV marketing spend, with user-level data from multi-touch attribution (MTA). This approach allows UMM to bridge the gap between aggregated data and user-level data, providing a more comprehensive and accurate view of marketing performance. Thus, allowing marketers to get almost scientific with campaign performance and budget allocation.
To keep this simple, let’s look at an example; a digital out of home (DOOH) campaign for a luxury design brand is currently running in magazines, complemented by a branded paid search campaign.
MMM allows for an analysis of the DOOH campaign at an aggregated level, helping to understand its overall impact on sales during and after the campaign's lifespan. On the other hand, MTA provides user-level insights into the impact of the branded paid search campaign on individual customer journeys.
By combining these two sources of data within UMM, it is possible to gain a deeper understanding of the relationship between the two campaigns. Specifically, UMM enables us to calculate the impact of the DOOH campaign on customer journeys that include the branded paid search campaign. This level of analysis becomes very important when evaluating the effectiveness and interdependency of different channels and deciding if a company should invest in a particular campaign type again or try something else. In fact, according to Forrester Research, UMM now makes up 28% of the measurement solutions on the market!
How does UMM work?
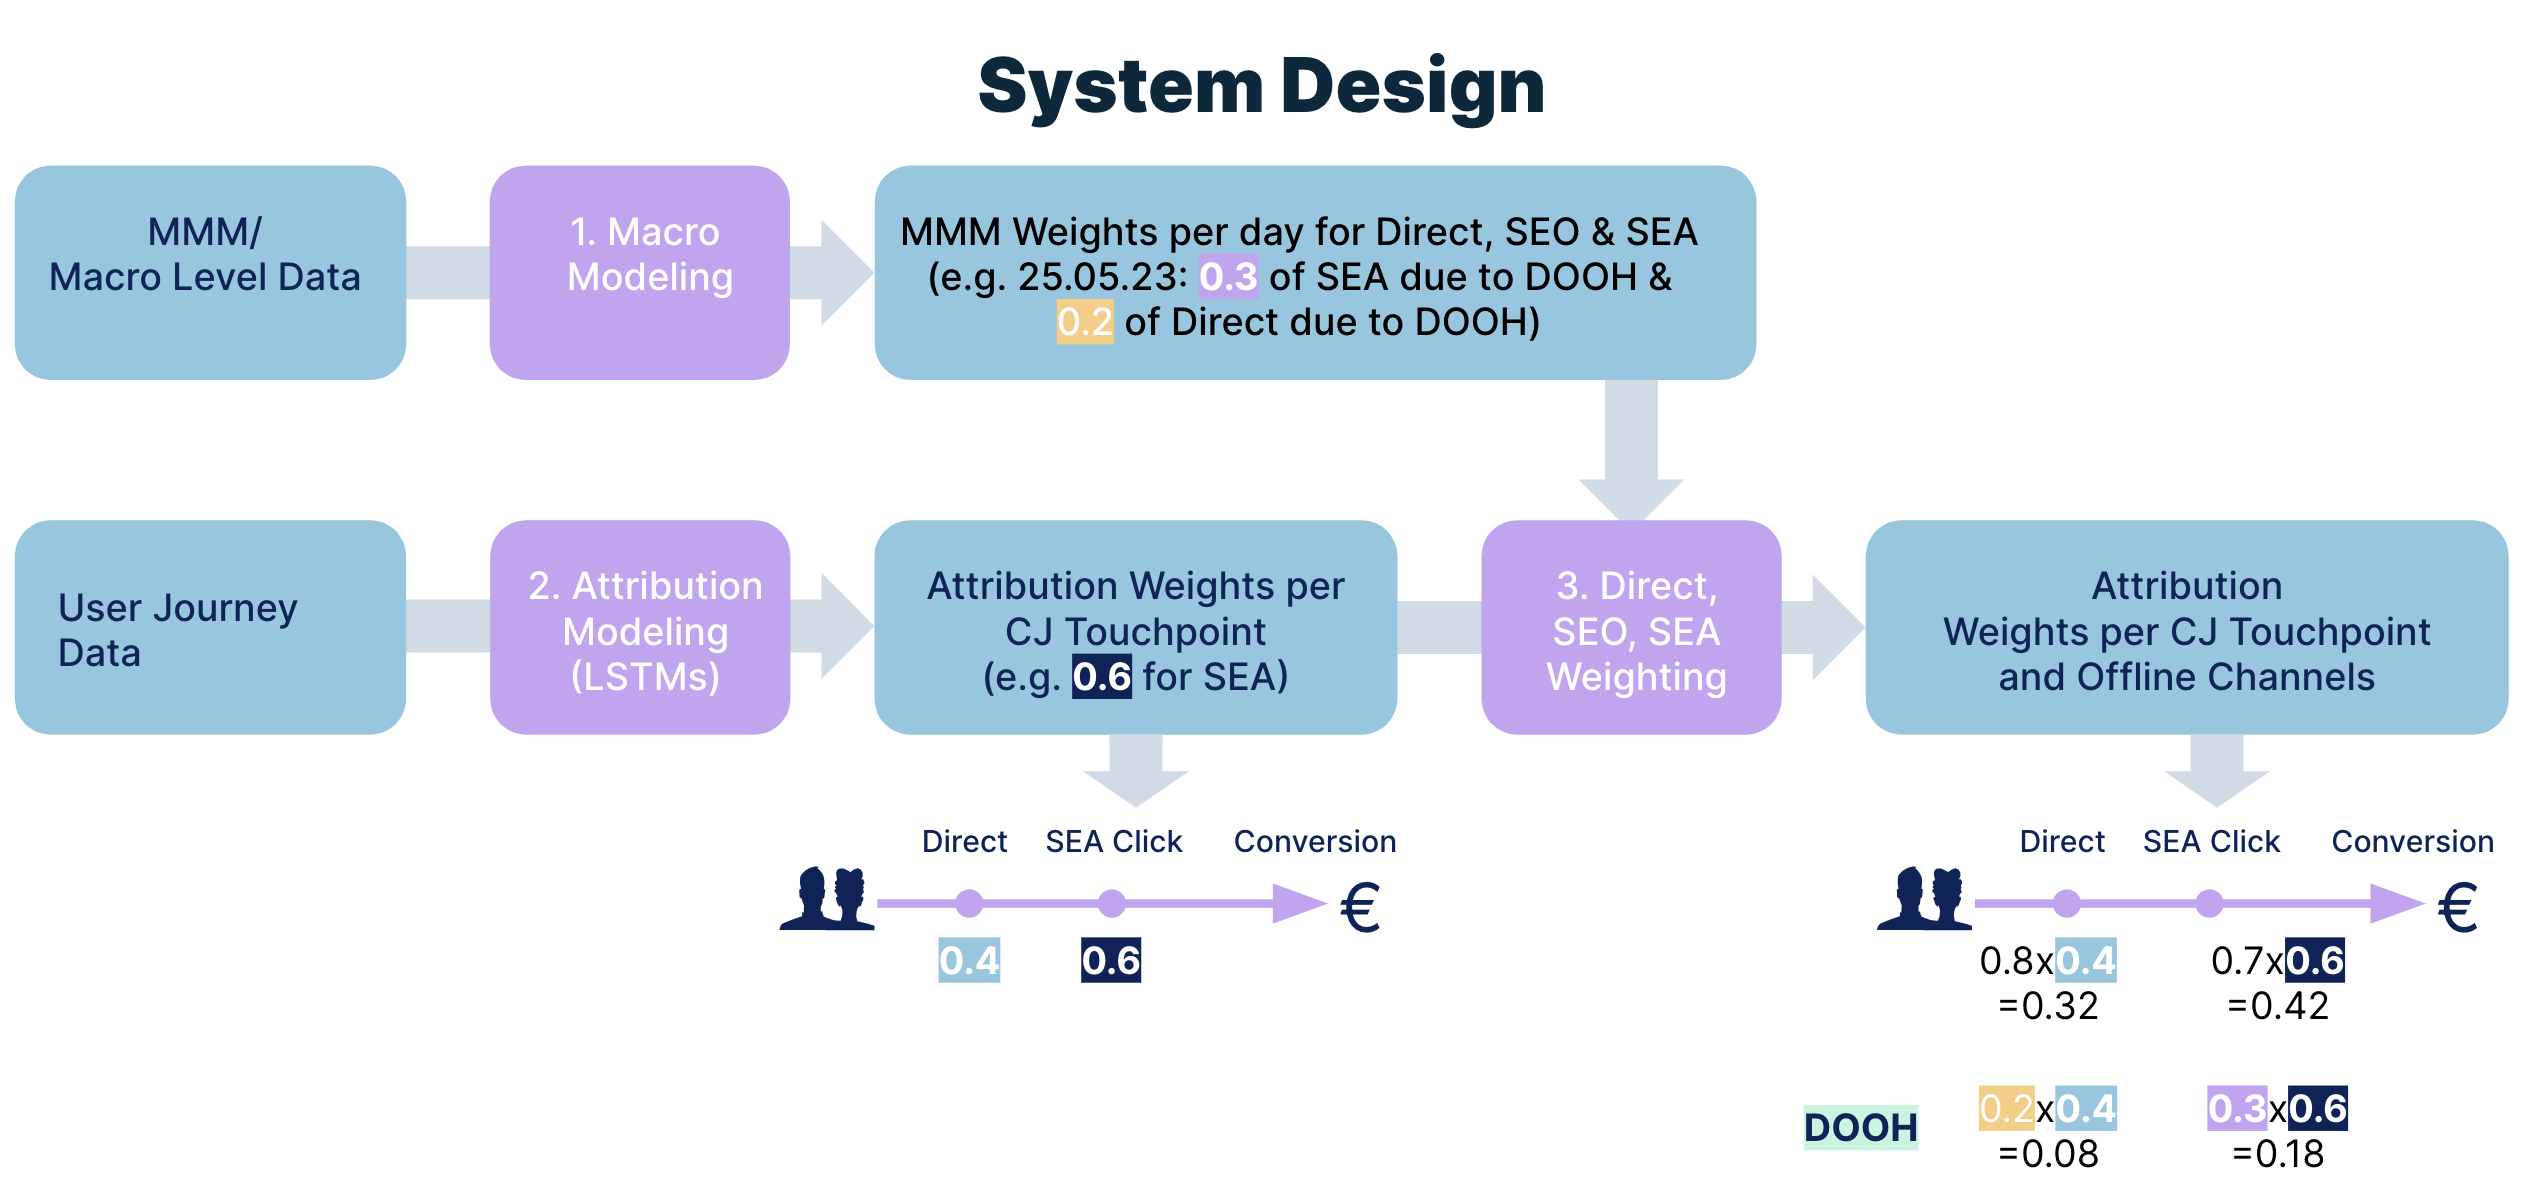
So, how does UMM work its magic here? To start, a marketing mix model is developed to analyze how marketing activities, including DOOH campaigns, impact branded paid search clicks. The resulting model takes into account all external factors, such as seasonality and global pandemics, while also accounting for adstock effects from previous marketing activities.
The output from the macro-level analysis of MMM, represented as a proportional factor (e.g., 0.3, indicating how much impact the DOOH campaign had on branded paid search on a given day), is fed into the micro-level analysis of MTA. This enables the aggregated data from the DOOH campaign to be treated as a synthetic touchpoint in customer journeys.
Funnel's MTA runs LSTM loops to reveal how much the paid search click impacts sales in converting customer journeys. For example, the analysis might reveal that the branded paid search click impacted sales by 60% (0.6) and direct by 40% (0.4).
This MTA weighting factor of 0.6 (0.4) is multiplied by the proportional factor of 0.3 (0.2 for Direct, from above), revealing that the DOOH campaign's actual impact on this conversion is 0.3 * 0.6 + 0.2 * 0.4 = 0.18 + 0.8 = 0.24. So, this means that the DOOH campaign's actual impact on the conversion is 24%.

This calculation provides a more accurate understanding of the relationship between different marketing activities and their impact on customer behavior, enabling companies to make better decisions about how to allocate their marketing resources.
Validity of UMM results
As a marketer using attribution software to understand the impact of your activities, you don’t need to look at individual weights to understand the big picture because software solutions like Funnel give you insights that are simple to understand, and you can use right away.
While we are on the subject of assurance, how do we know that our algorithm will deliver accurate data about your marketing ROI? To ensure that you receive only significant results, we validate our models statistically using R-squared, Mean Absolute Percentage Error (MAPE), Area Under the Curve (AUC) and other quality metrics, common in machine learning, for each model. These methods display the discrepancy (or error) between the model's estimated results and the data from the real world and show whether this error is sufficiently small for the results to be considered valid.
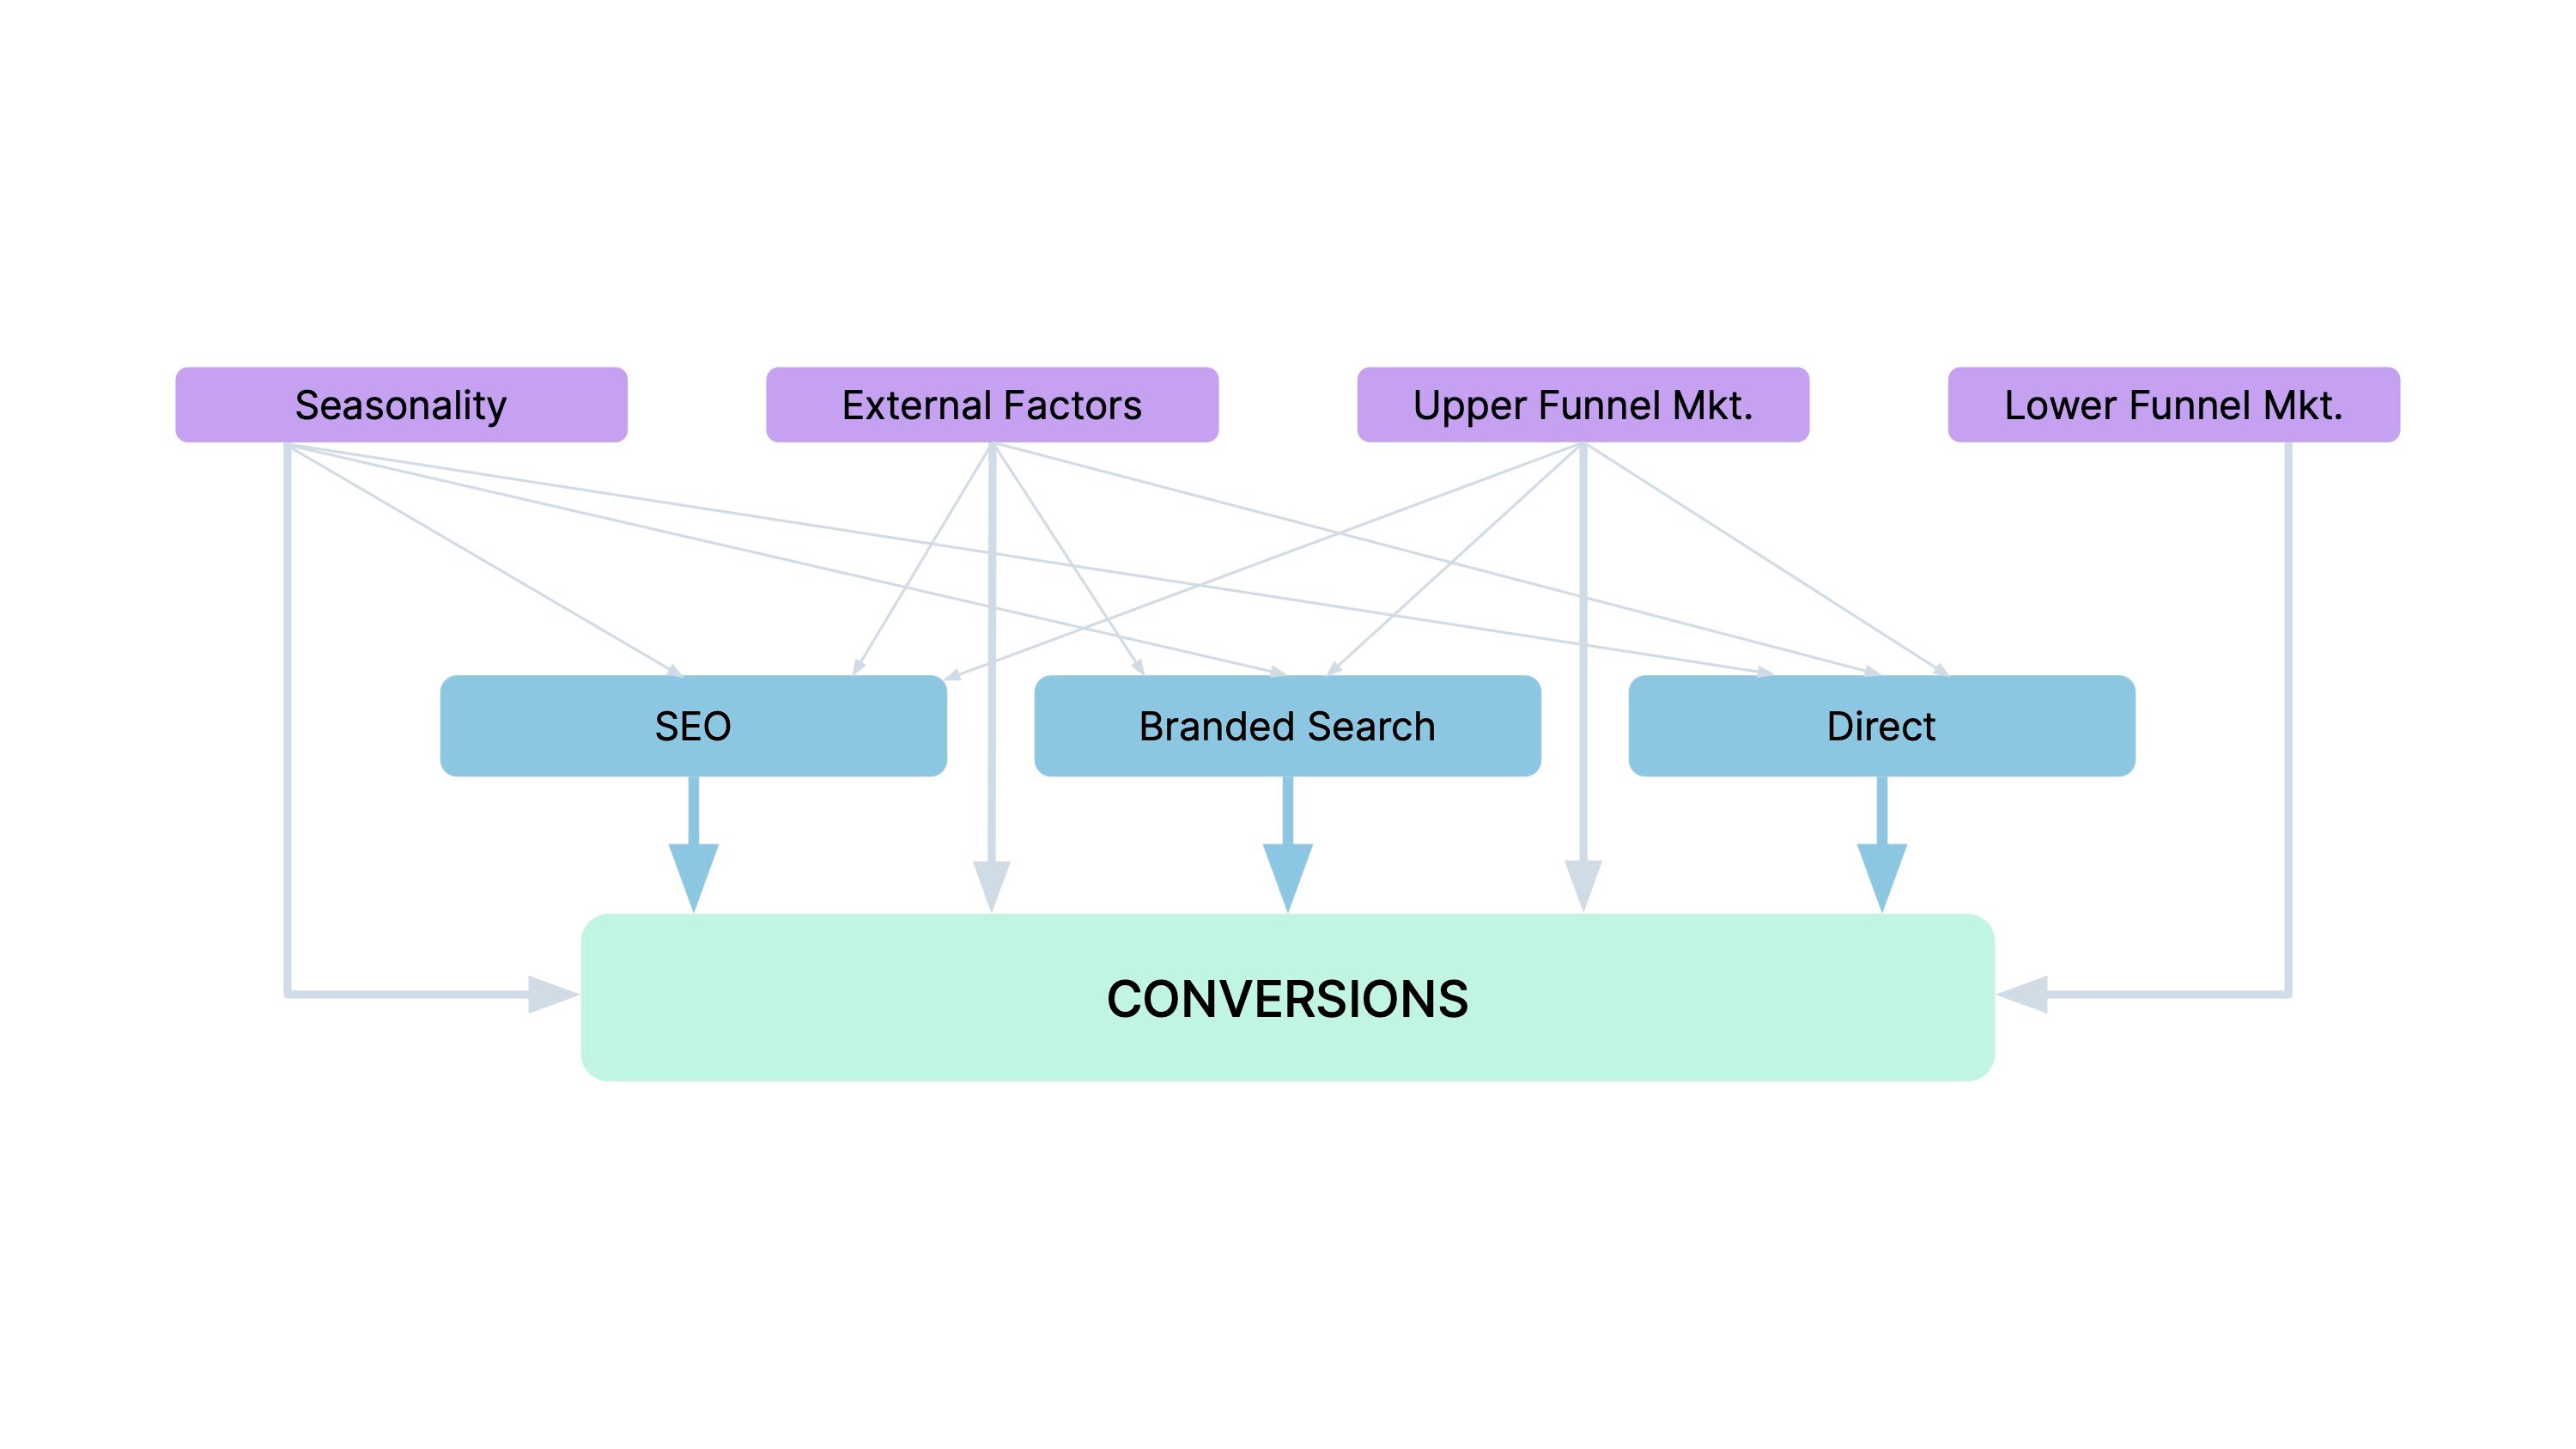
We further improve our algorithms with a hierarchy of models that take into account how external factors (such as seasonality), on-site activities (such as "add to cart"), and marketing efforts (such as social media campaigns) affect sales indirectly as well as directly, resulting in a complex interdependent system.
Why should marketers use a UMM solution?
As measurement complexity continues to increase, marketers need evidence-based decisions more than ever. Attempting to understand single activities or siloed parts of the customer journey is no longer sufficient. Now, a complete, holistic view of marketing activities is necessary to instill confidence in a company’s marketing team. With complete transparency and trust in the validity of results, UMM allows marketers to make strategic and tactical decisions with their marketing budget and overall planning.
Want to upgrade your marketing measurement?
Our unique AI-powered model integrates marketing mix modeling, multi-touch attribution, and incrementality testing to reveal what truly drives your marketing success. Quickly identify underperforming channels and the campaigns that truly move the needle.
While both MTA and MMM are well-known analytical frameworks, there are some restrictions on the types of data and outcomes that can be taken into consideration. In terms of micro-level analysis of customer journey touch points, MTA can be great. However, it fails to examine offline touch points. With a macro-level view of calculating brand effects, seasonality and the impact of entire marketing campaigns on total sales, MMM can account for precisely that.
As we’ve detailed, however, UMM combines these two methodologies and provides a fully integrated view. Thus, illustrates how offline sources, where only aggregated data is available, can have an impact on a user's experience during a customer journey. With UMM you can accurately determine the impact of your cross-channel marketing mix, comprehend your baseline sales and determine the incrementality of your activities. Companies around the globe are seeing the array of benefits of UMM, including Spring, an online men’s health platform, which increased its ROAS for TV by 256% using our UMM solution!
If your marketing team still relies on incomplete data and guesswork, UMM is the solution you have been looking for.
-
 Written by János Moldvay
János Moldvay is Funnel's VP of Measurement. He has more than 20 years of experience working in the marketing data and measurement space.

