



 Get in touch
 Log in




Have you ever opened up Data Studio (formerly Looker Studio) and spent a minute staring at the loading spinner just to see your report? To get your data to load, you kill a data connector. The next day, your manager pings you to ask why the channels are missing.
Of course, Data Studio is perfect for basic data visualization. It's free, fast and highly useful if you’re within the Google ecosystem. But when your channel mix grows more complex, cracks appear that slow down your efficiency.
If you’ve reached the breaking point and are looking for alternatives to Data Studio, just swapping the dashboard won’t fix a broken data pipeline. Most marketing teams don't actually have a visualization problem; they have a data harmonization problem. If the data feeding the charts is messy and unreconciled, a new UI will just show you the same errors.
The right Data Studio alternative depends on whether your team needs better visualization, better data foundations or both. In this article, you’ll learn how to identify your data needs and determine which platform is right for you.
Why marketing teams outgrow Data Studio
Data Studio is Google’s web-based data visualization tool that, up until April of 2026, was called Looker Studio.
The frustration marketers often feel with Data Studio isn’t down to how they’re using the tool. It's in how Data Studio works once your reporting grows past a Google-only setup. And once you see where the limits are, the pull toward an alternative makes a lot more sense.
Usage caps are easily reached
Google caps data blends at just five sources, which is a real blocker for teams scaling their marketing mix. Additionally, dashboard space is rationed, with pages maxing out at 50 native Google charts and just 30 for partner data. And if you’re reporting for clients, PDF exports only render the exact data visible in the widget thumbnail, which clips long tables unless you adjust them by hand, line by line.
Performance that declines as you scale
Speed is usually the next pillar to give way. The lag happens because every element on a dashboard fires a fresh query against the source each time the page loads, unless the result is already cached, and memory-hungry features like merged results and custom fields make it worse. The more data points you pour in, the slower the whole thing gets.
Distribution and delivery limits
Sharing your work isn’t frictionless either, as free Data Studio accounts carry daily and monthly email send quotas, and scheduled reports are capped at 50 recipients. You also won't have a branded client portal, which makes client reporting hard if you’re an agency. To work around this, teams that need hands-off delivery will bolt on a dedicated automated reporting tool.
The marketing data gap
The core analysis problem within Data Studio is the technical wall between advertising ecosystems. On the one hand, Google’s native tools sync seamlessly, but integrating others like Meta, LinkedIn and HubSpot requires expensive third-party data pipelines. As your media mix grows, these platform subscription fees can rapidly compound.
Because these connectors are unmanaged, routine API changes by external platforms will break your reporting pipelines out of the blue and force your team to troubleshoot manually to reconnect them. When you combine a fragile infrastructure with the heavy manual manipulation required for cross-channel attribution, data maintenance becomes increasingly burdensome every month. For modern marketing teams juggling multiple channels, it’s a costly baseline.
Two paths to a better marketing reporting setup
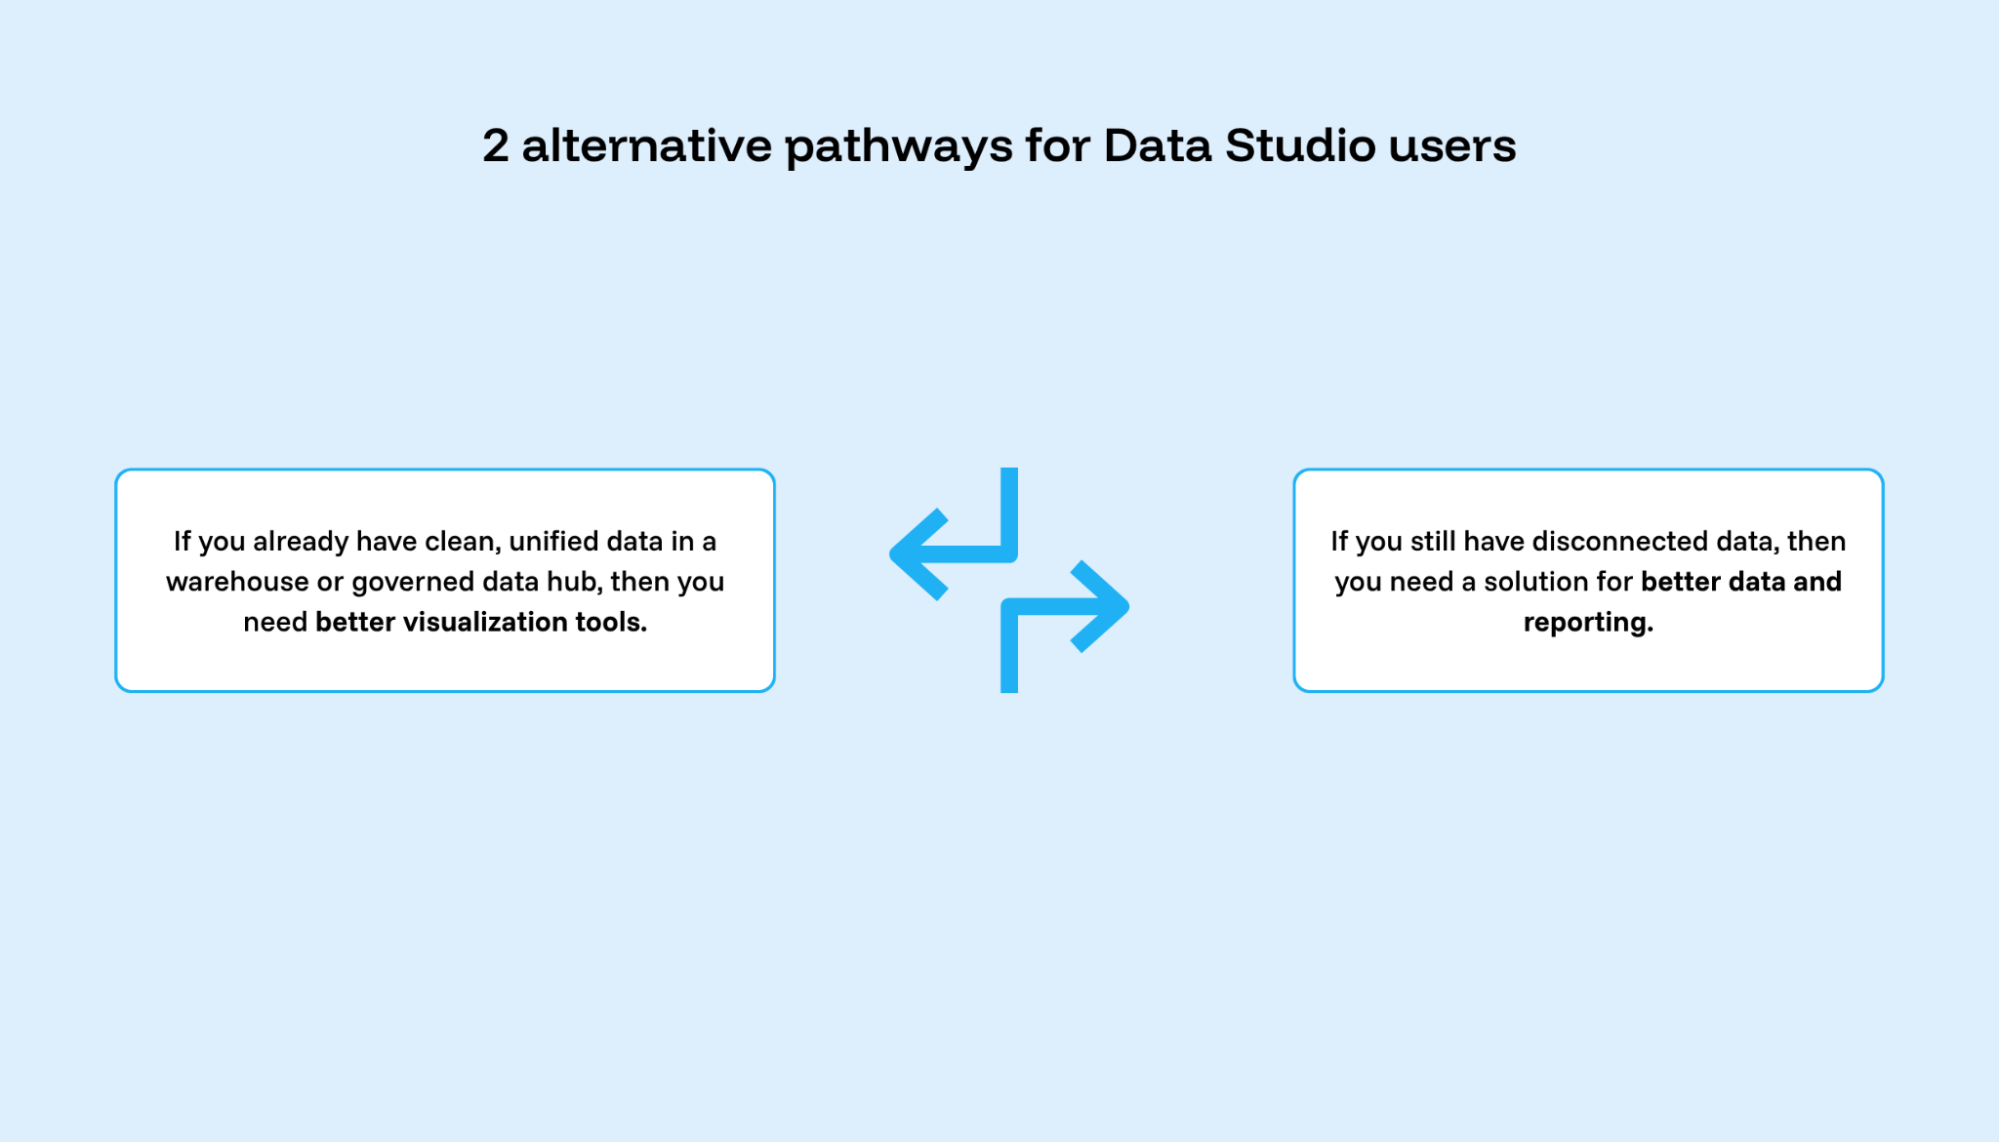
When teams outgrow Data Studio, they tend to land in one of two camps, and working out which one you're in matters far more than picking the highest-rated tool on a review site. The two camps face genuinely different problems, and no single tool solves both.
Path 1: better visualization tools
Some teams have their data house in order. If yours is already clean, harmonized and sitting in a data warehouse, and your only real complaint is that Data Studio's chart options, performance or governance can't keep up, a more powerful charting layer is what you're after. Our overview of BI tools gives you a useful, in-depth view of the category.
Path 2: better data foundations plus reports
For many teams, the real problem lies upstream. Data is scattered across a dozen platforms, metrics refuse to reconcile, connectors break without warning and every dashboard rests on shaky ground. Teams in this camp need to fix integration and harmonization first, then decide whether to feed that clean data into a visualization tool they like or lean on a built-in data reporting layer.
So, ask yourself, if you swapped Data Studio for a tool like Tableau tomorrow, would your reports become more useful, or just better-looking? If it's the latter, the bottleneck is in the data.
The top Data Studio (Looker Studio) alternatives for marketing teams in 2026
The six platforms below cover both routes out of Data Studio. Some are visualization tools that give you more power over how reports look and perform, suited to teams whose underlying data is already in good shape. The rest work further down the stack, connecting and cleaning your marketing data before it reaches a chart at all.
1. Funnel: the marketing intelligence choice
For most marketing teams and agencies, Funnel is the best Data Studio (Looker Studio) alternative because it fixes the root cause of the frustration: messy data feeding the dashboard.
Where Data Studio caps each blend at five sources, Funnel joins data from dozens of marketing platforms upstream, so what reaches your report arrives as a single, clean source. It connects to more than 600 marketing platforms, well beyond the Google ecosystem. Because those connectors are managed, a platform changing its API becomes Funnel's problem to solve rather than yours. Your data keeps flowing while you get on with your day.
Better yet, "Clicks" can mean different things across Google Analytics, Meta and LinkedIn, and Funnel normalizes those metrics, along with currencies, attribution windows, and naming conventions, so cross-channel reports finally add up. Because it stores and pre-aggregates your data, your reports stop firing fresh queries every time someone opens them, which is the end of the loading-spinner problem that pushed you to look elsewhere.
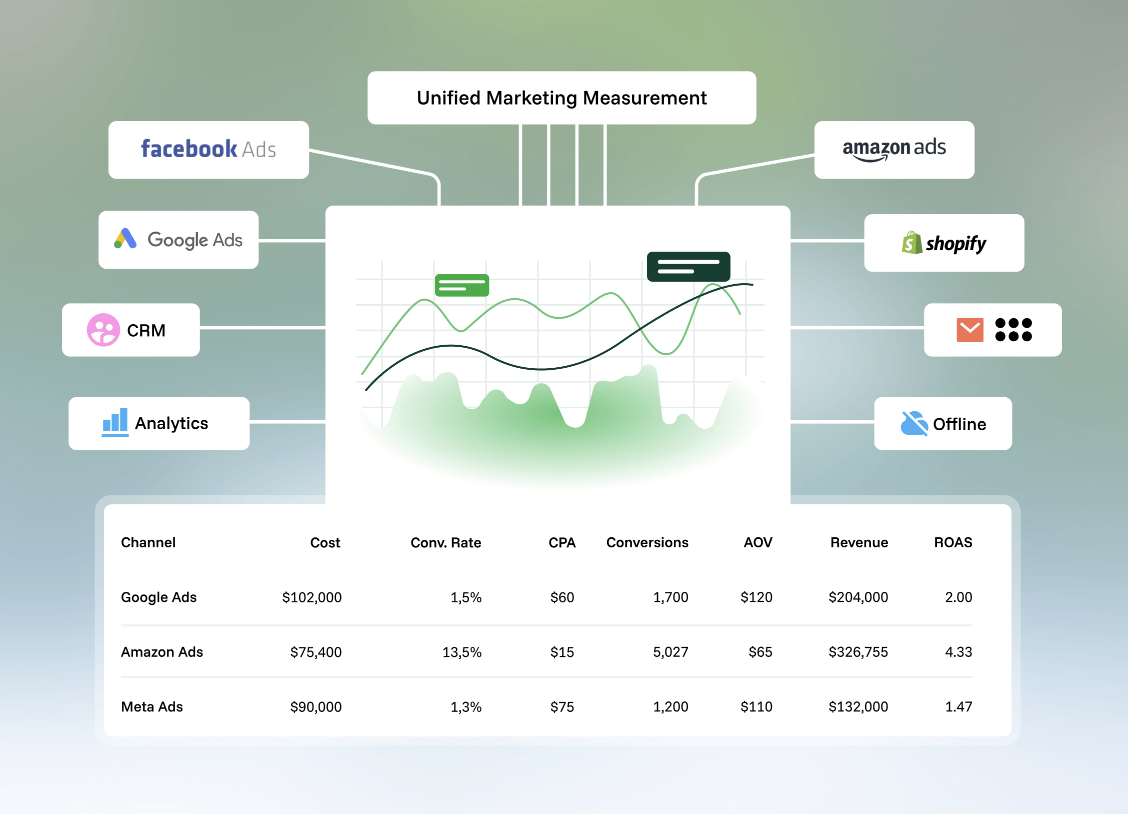
From there, you can send the clean data straight into Data Studio, Tableau, Power BI or Google Sheets, or build client-ready reports inside Funnel's own marketing dashboards. Either way, it's designed for marketers rather than engineers, so you don't need a data specialist on call to keep it running.
Funnel is the strongest fit for scaling marketing teams and agencies that need a single, trustworthy source of truth across 10 or more platforms.
2. Tableau: for advanced business intelligence
Tableau is a general business intelligence platform rather than a marketing tool. It works well for data visualization because it offers the most extensive customization on this list of tools and can handle millions of rows of data without lagging, something Data Studio struggles with most. If your team wants a broader selection of chart types and granular control, or needs strong user permissions for data collaboration, Tableau offers both.
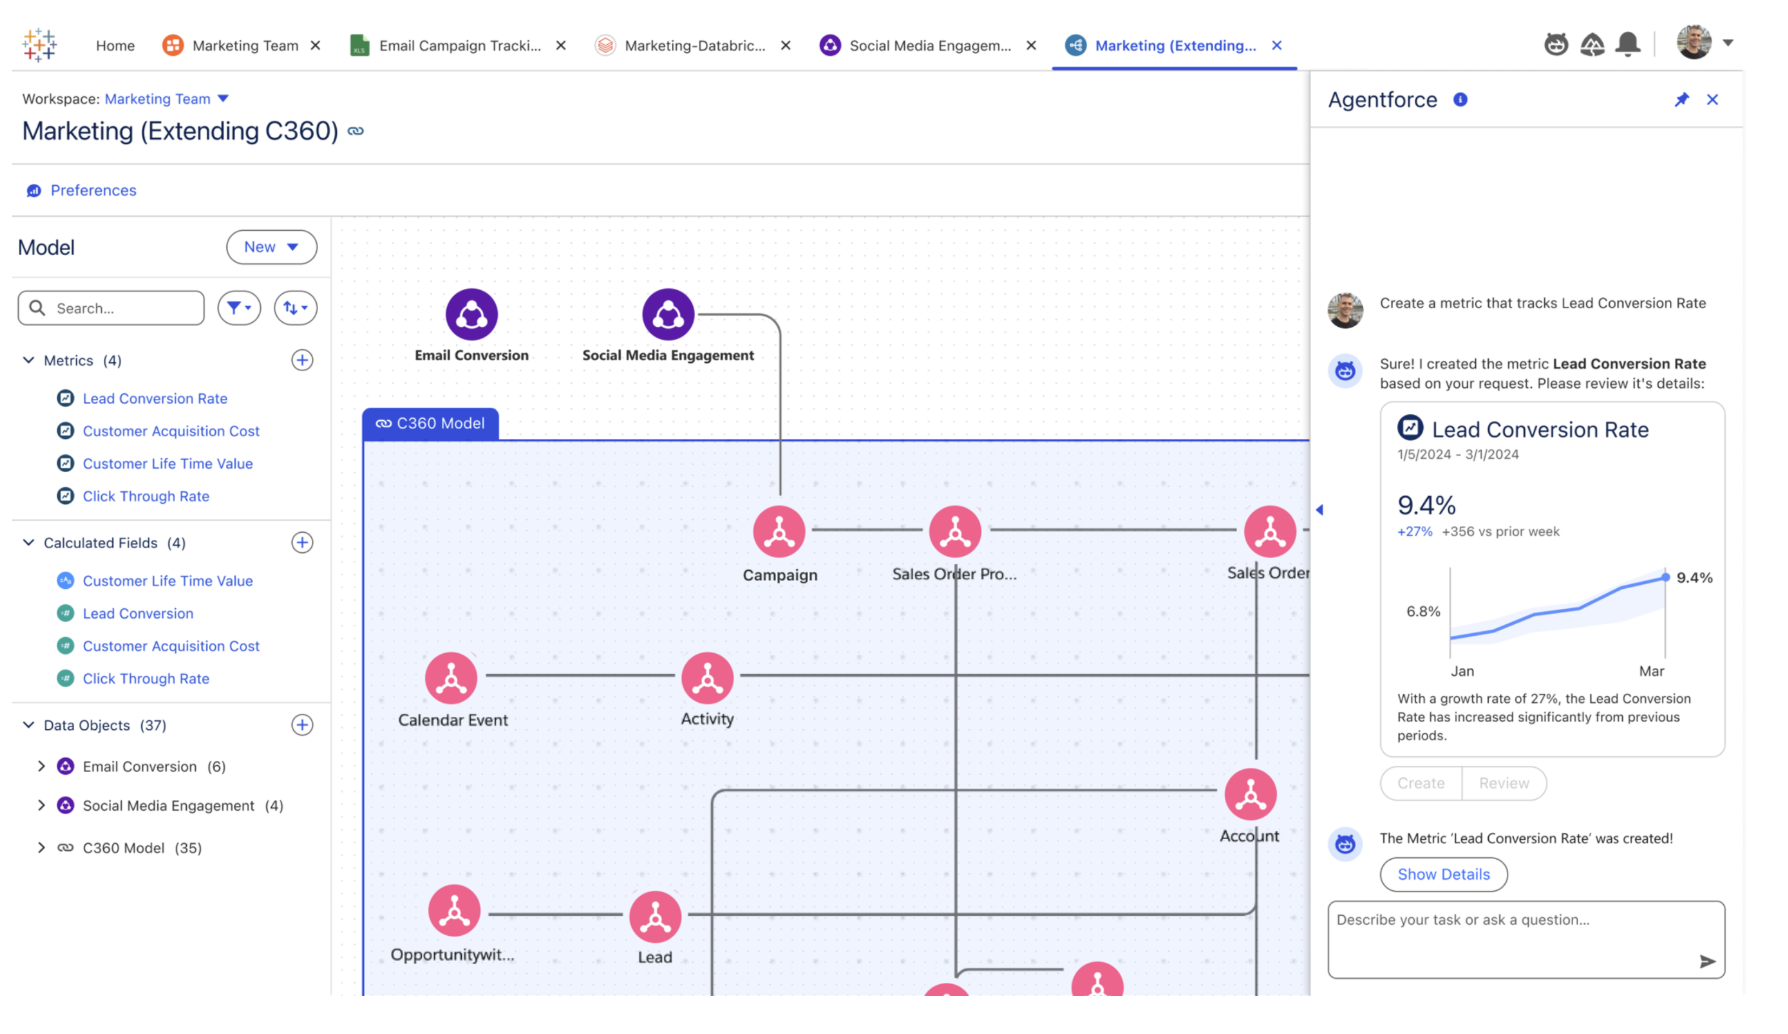
But Tableau won't solve your marketing data problem. Tableau lacks native connectors for Meta, TikTok and LinkedIn, so you'll still need a data integration layer like Funnel underneath to feed it harmonized cross-channel data. It's best suited to analyst-led enterprise teams that have already sorted out their data foundation.
3. Power BI: for AI-powered insights
Power BI is Microsoft's answer to Tableau, and it's a great fit if your organization already works with Microsoft's ecosystem. The key feature of Microsoft Power BI is that its in-memory engine handles large datasets far more gracefully than Data Studio's live-query model, and the built-in Copilot lets you generate charts from plain-English prompts, which lowers the barrier for less technical users.
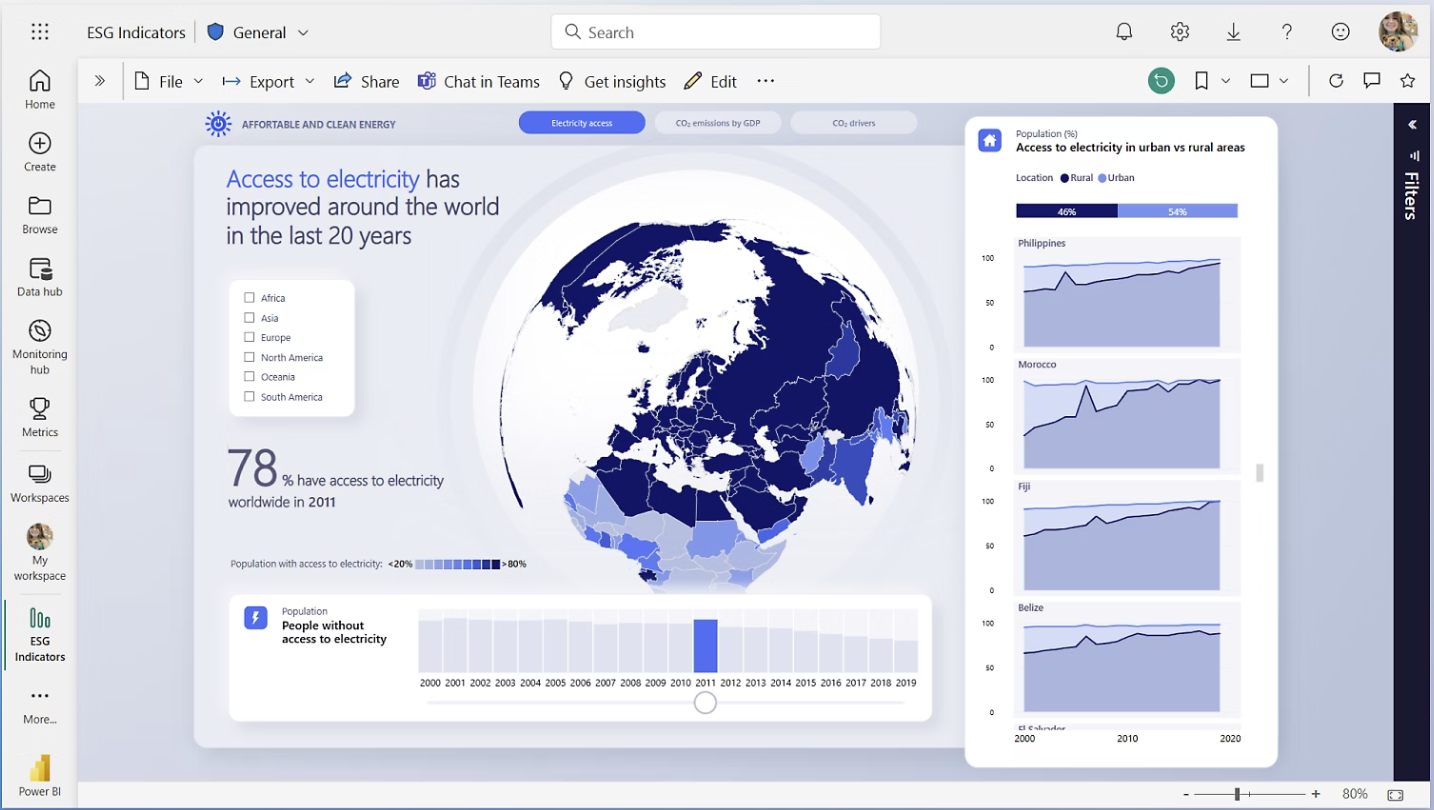
Like Tableau, though, its native marketing connectors are limited, so you'll likely need an external data layer to harmonize cross-channel data before it reaches Power BI.
4. Improvado: all-in-one for enterprise data insights
Improvado acts as a data foundation, and it can handle the manual work of cleaning and joining marketing data with managed pipelines that cut the time you'd otherwise spend fixing broken APIs. For large organizations, the appeal is having a single vendor cover the entire stack rather than stitching together a data tool and a reporting tool.
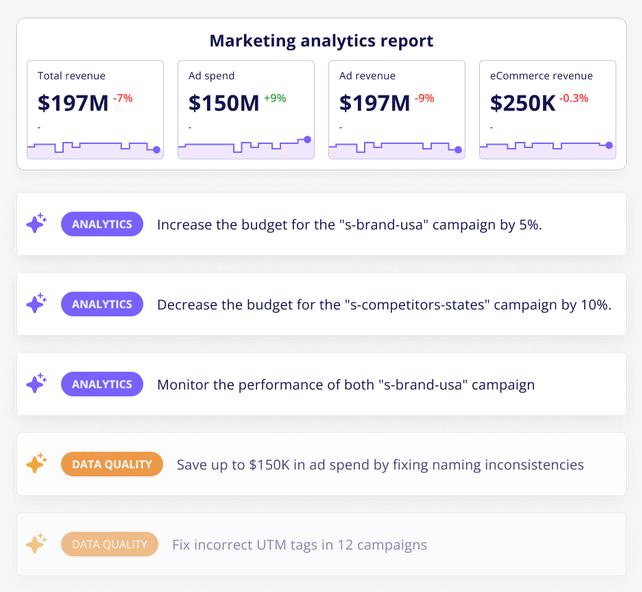
The trade-off is that Improvado is built for the enterprise level, which means a higher price point and a heavier implementation process than you may need. It's best for large in-house marketing teams that want a single vendor to handle everything end-to-end.
5. Whatagraph: for agency data visualization
Whatagraph is built for agencies that need to churn out client reports on the fly without having to start from scratch. Setup is super fast with the tool’s drag-and-drop interface. You can send as many reports as you want because Whatagraph completely bypasses Data Studio's frustrating delivery limits. If you’re sending the same reports to dozens of clients every month, the automation will save your team hours of manual work that can be spent on strategy.
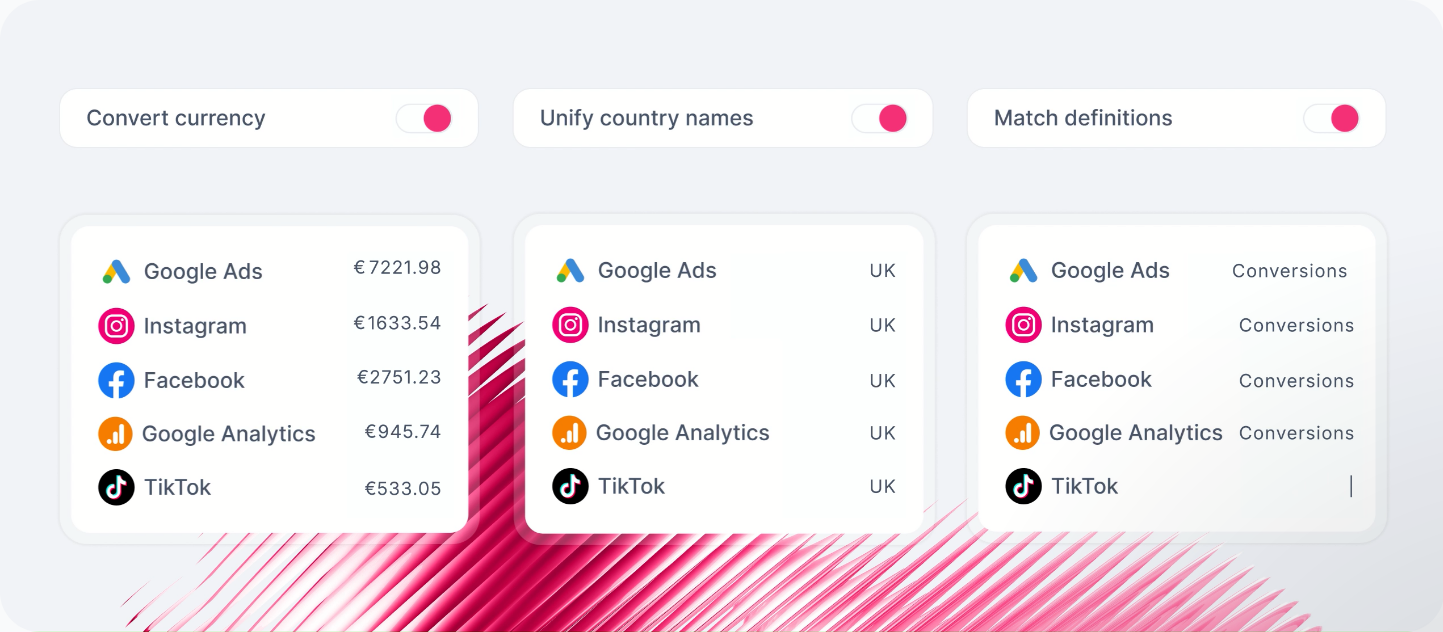
But Whatagraph's trade-off is coverage, because it only offers a few dozen native integrations. If your clients use a highly diverse mix of platforms, you’ll hit a wall fast. It makes the most sense for mid-sized agencies where white-labeling and keeping clients in the loop matter much more than advanced data modeling.
6. AgencyAnalytics: for small-to-mid-size agencies
AgencyAnalytics stands out for bundling client reports with built-in SEO tools, including rank tracking and site audits, which are capabilities Data Studio lacks out of the box. The tool also includes easy-to-manage white-labeled client portals, so it’s a great turnkey solution for agencies that want professional, interactive dashboards without bolting on other tools.
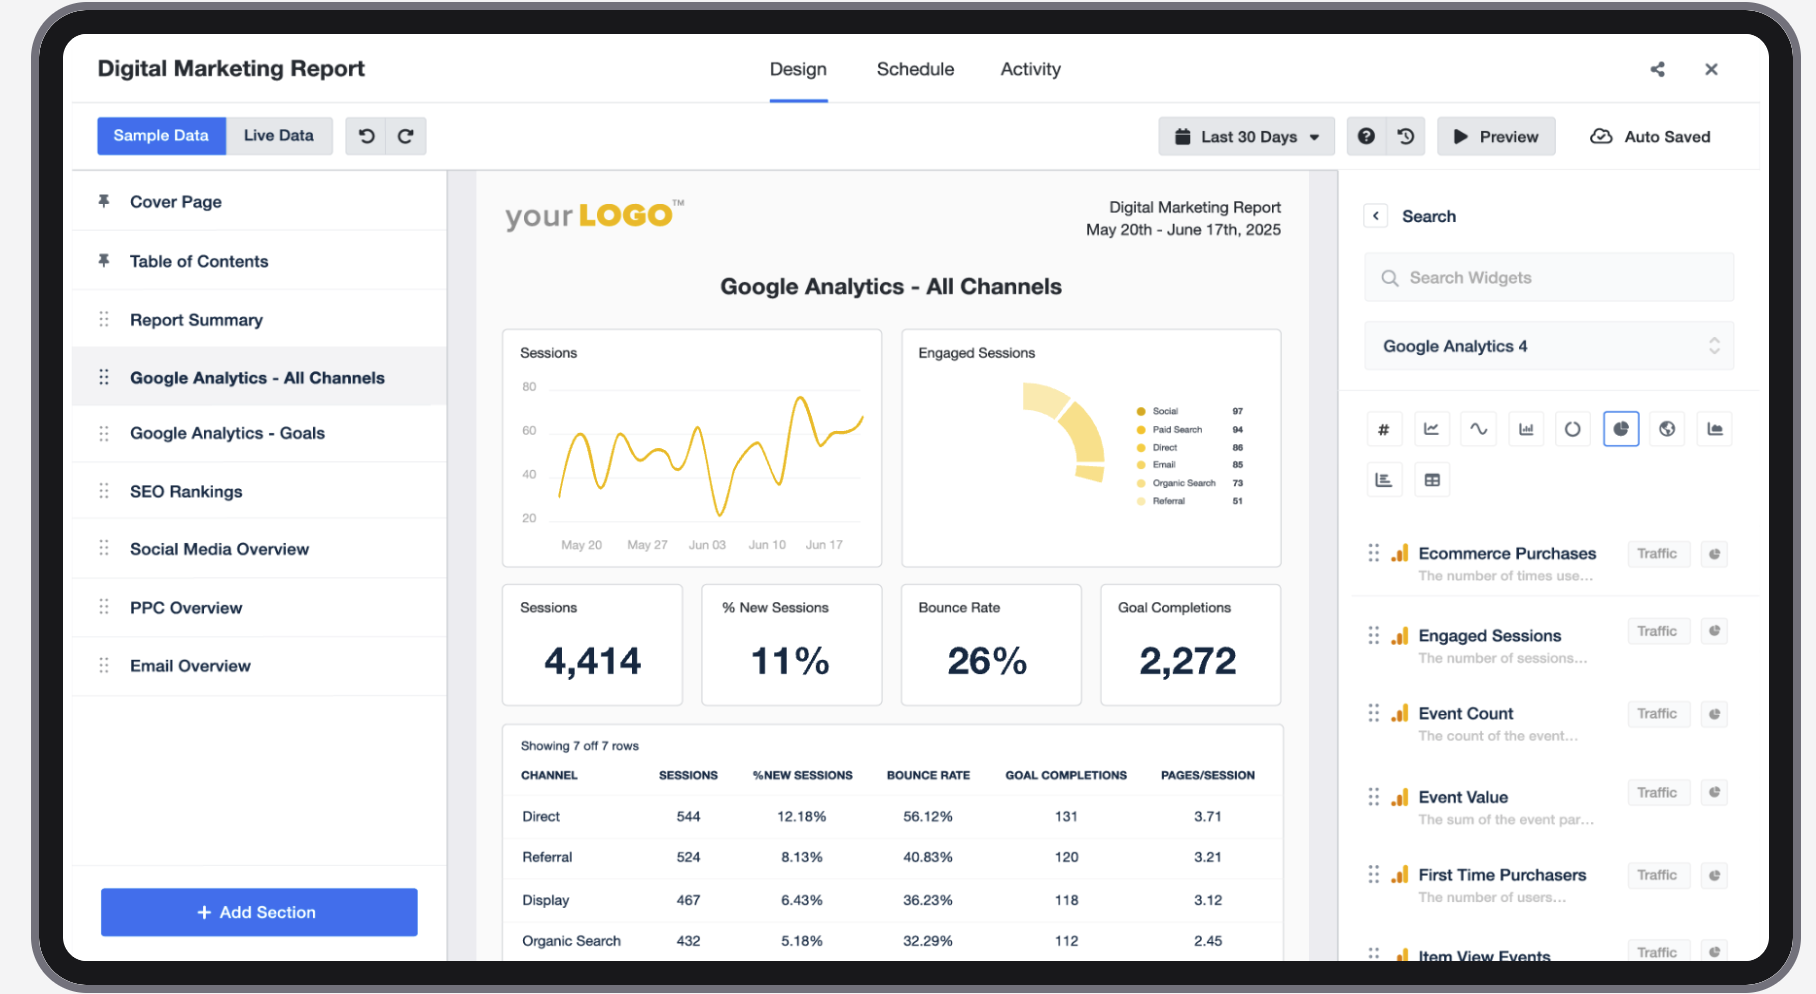
However, the all-in-one simplicity is also AgencyAnalytics's limit. The platform leaves little room for complex, custom data modeling. It fits agencies with a steady client roster where the priority is a clean, reliable dashboard rather than deep data engineering.
Here’s an overview of the main alternatives to Data Studio (formerly Looker Studio) so you can quickly see how they compare.
|
Tool |
Path |
Best for |
|
Funnel |
Data foundations + reporting |
Scaling teams and agencies that need one trustworthy source of truth across 10+ platforms |
|
Tableau |
Visualization |
Analyst-led enterprise teams with the data layer already solved |
|
Power BI |
Visualization |
Teams already running on Microsoft 365 |
|
Improvado |
Data foundations + reporting |
Large in-house teams wanting a single vendor for the whole stack |
|
Whatagraph |
Data foundations + reporting |
Mid-sized agencies focused on white-label client reports |
|
AgencyAnalytics |
Data foundations + reporting |
Smaller agencies that need SEO tracking alongside data reporting |
How to choose the right Data Studio alternative for you
Before you commit to an alternative to Google’s Data Studio, you need to identify what needs fixing. Work through the following questions against your own reporting, and the right category will present itself.
Is the problem your data, or do you just want better data visualization?
You're dealing with a data problem if the following feels familiar:
- Numbers for the same campaign don't match across Google, Meta and LinkedIn.
- You spend the first 10 minutes of every meeting explaining why today's numbers look different from yesterday's.
- A connection breaks, and you only find out because someone else notices.
- You can't add more platforms to a report because you've hit a tool limit.
- Your team spends more time getting spreadsheets under control than reading results.
On the other hand, you're dealing with a visualization problem if these ring true:
- Your data is already organized in a warehouse, but your charts look amateurish.
- Reports take forever to load, even though the data is ready.
- You need high-level security, edit histories or locked views for different users.
- Stakeholders want custom visuals that basic templates can't handle.
Whose reports are these?
Think about who reads your reports, because that will influence what they need from you. If marketing, finance and leadership all work from the same report, you've probably sat through an argument about whose numbers are correct. A reliable data foundation prevents that argument. And if you're sending reports to clients, how they look matters as much as what they say, so you'll want an agency-focused tool with a clean data layer to support them.
What are your team's advanced analytics skills?
If you have non-technical users on your team, resist the pull of Tableau or Power BI; you'll end up with a half-built dashboard nobody trusts. A managed platform or agency-focused tool will serve you far better.
If you have extensive technical expertise on the team, you've got the capacity to run a separate visualization layer well, paired with a clean data source. That combination is the most flexible setup on offer.
And if you have engineering resources, self-managed pipelines can work, though engineering time has a way of getting pulled elsewhere while pipelines quietly rot, which is why marketing teams at this stage find a managed platform pays for itself in saved maintenance. For more on building the practice around your tools, our digital marketing reporting guide goes deeper.
Build your reports on the right data foundation
The marketers who get reporting right aren't necessarily the ones with the biggest budgets. It’s usually those who figure out what’s broken before they sign a new contract.
Data Studio isn't a bad product; it’s just more often than not used for the wrong job. Asking it to clean and match up data from five different ad platforms is like asking a painter to fix your plumbing. If your data is a mess, a more expensive dashboard won't help.
If you’ve used the framework and found that your data foundation is shaky, start there. Funnel handles the hard work by connecting to 600+ platforms and cleaning that data before it ever reaches a chart. Whether you then send that clean data to Tableau, Power BI or just use Funnel’s own reporting dashboards is up to you.
Ultimately, the goal is to stop fighting with your tool so you can have more trust in your numbers. Once the data foundation is right, every subsequent decision becomes easier.
Frequently asked questions
What is the best free alternative to Data Studio for marketing teams?
There isn't a truly free alternative to Data Studio for cross-channel marketing reporting. Free tiers work well enough for single-channel, Google-only reporting, but they break down the moment you add third-party tools. For any team running several paid channels, the cost tends to reappear elsewhere, either as third-party connector fees or as the hours your team spends reconciling data by hand.
Is Looker Studio the same as Data Studio?
Looker Studio is the same as Data Studio. It’s Google’s free data visualization tool. On April 11, 2026, Google renamed Looker Studio back to Data Studio, according to the Google Cloud blog.
Data Studio also has a paid version, Data Studio Pro, which offers better security and additional features, like team workspaces, but has many of the same limitations. Looker is Google’s enterprise business intelligence solution.
Is Funnel a Looker Studio alternative for data analytics?
Yes, and for most marketing teams, it's the strongest one. Funnel solves the problem that sits underneath the dashboard: the messy, unreconciled data feeding your charts in the first place. You can use Funnel's own reporting dashboards in place of Looker Studio (now Data Studio), or you can keep Looker Studio as your visualization layer and let Funnel feed it clean, harmonized data.
Data Studio (Looker Studio) vs. Funnel for data modeling: which is better?
They solve different problems, so the better choice depends on what's broken. Data Studio is a visualization tool that draws charts from whatever data you hand it. Funnel is a data layer that connects, cleans and standardizes marketing data across platforms, with reporting built on top. If your charts look fine but your numbers don't add up, Funnel is the better fit. If your data is already clean and your only gap is visualization, Data Studio may be all you need.
What are the cons of Data Studio compared to BI tools?
Most of the cons of Data Studio are in how it's built. For example, data blends max out at five sources. Anything outside Google needs a paid third-party connector, and since those connectors aren't managed, an API change on the platform's end can break your data feed until you fix it. The speed at which charts load suffers, too, as your datasets grow.