
We’re decades deep into data-driven marketing, yet, according to Statista, only 14% of companies say they have a 360-degree view of their customers. The rest are drowning in disconnected dashboards, messy spreadsheets and endless copy-paste.
The right dashboard tool can turn things around for marketing teams at both companies and agencies. But you don’t just need a solution for charts that look slick. The really powerful marketing dashboard tools bring together data from multiple sources and make insights easy to share and act on.
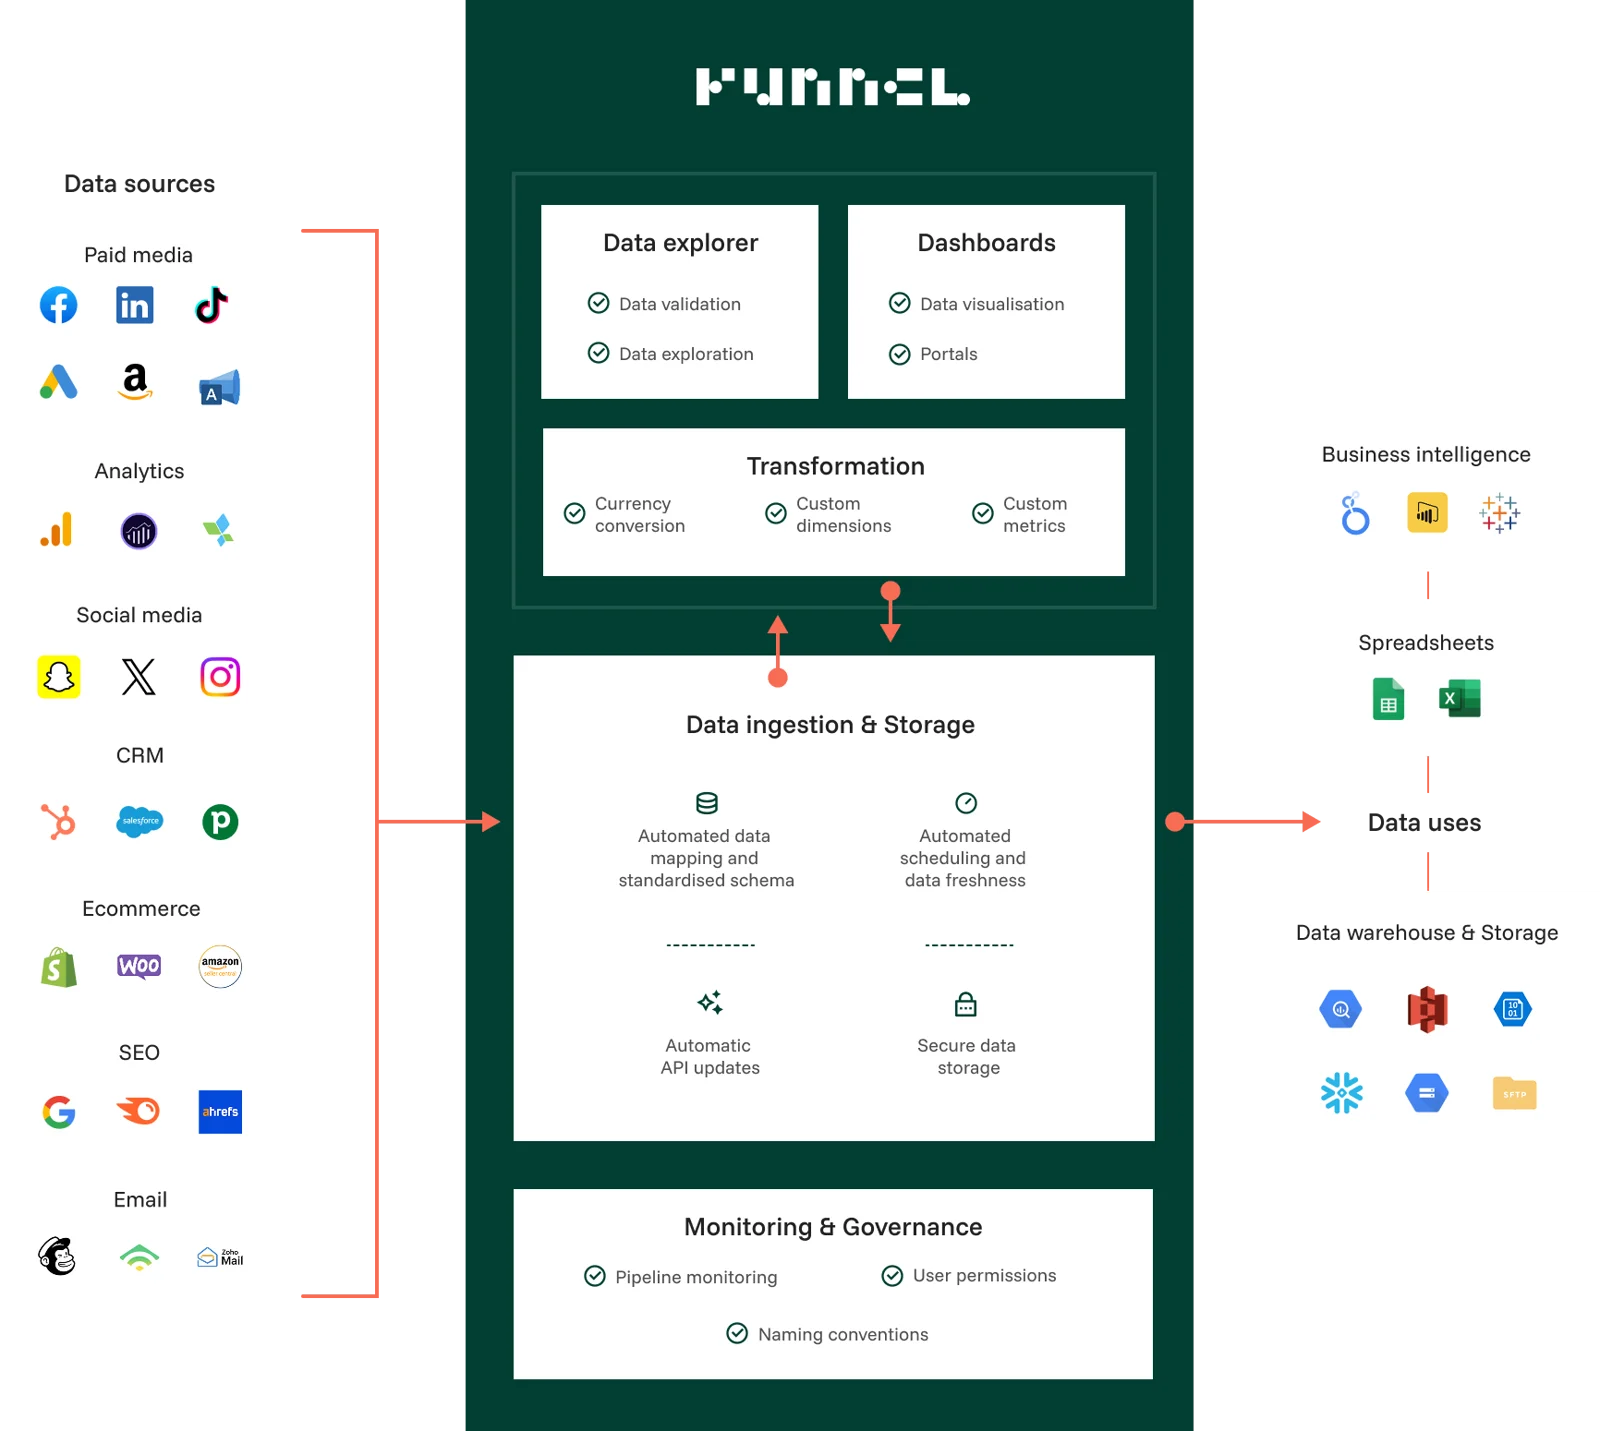
There are plenty of dashboard options, from BI systems that cover the whole enterprise to simple tools with pre-built templates. But the reality is: all of these depend on one thing to work properly — clean, connected and trustworthy data. That’s where Funnel stands apart. It isn’t just a dashboard tool. It’s the marketing intelligence platform that fixes the data chaos first, then powers dashboards, measurement and predictive planning on top. Whether you’re a marketing team managing multi-channel performance or an agency reporting across dozens of clients, Funnel gives you a single source of truth to analyze, report and share insights securely.
Before you compare tools, it’s worth understanding what a marketing dashboard actually does and what separates the good from the frustrating.
2026 Marketing dashboard tool buyer’s guide
Choosing a dashboard tool is one of the highest-leverage calls a marketing team can make. Pick the wrong one and you’re stuck with manual fixes and wasted hours. Pick the right one and you unlock faster decisions and a real edge.
Integrations that actually cover your stack
Too many tools still stop at Google and Meta. The average marketing team now uses more than a dozen different platforms for marketing campaigns and analytics. If your dashboard cannot connect to all of them, you’ll end up back in spreadsheets.
Data cleaning you don’t have to babysit
Gartner estimates that poor data quality costs businesses an average of $12.9 million a year per company. If a dashboard cannot normalize campaign names, currencies and time zones automatically, you will pay for it in both dollars and credibility.
Visualization that flexes to your needs
Prebuilt charts might impress in a sales call, but you need freedom to design views for CMOs, channel managers or finance. The best dashboards are as flexible as the questions you’ll be asked.
Scalability that doesn’t slow down
Data volumes are exploding. Statista projects the global datasphere will reach 230 zettabytes in 2026. The tool you choose must keep up as campaigns and markets grow without grinding to a halt.
Pricing that lines up with value
Whether pricing is per user, per connector or tiered, the real test is whether the tool pays for itself by saving hours and surfacing insights that change spend decisions.

The strongest digital marketing dashboard is connected to every source in your stack, enforces consistent naming and currency rules, handles scale without lag and makes it easy for teams to move from raw numbers to actionable insights.
They reduce reporting time, cut manual errors and create a foundation for measurement that finance and leadership can trust.
The following tools stand out for their ability to unify data, simplify reporting and give marketing teams the accuracy and speed they need to act with confidence.
Our top 7 marketing dashboard tools
According to Chiefmartec, more than 14,000 marketing technology tools are fighting for attention right now. Choosing from the number of dashboards alone can feel endless, which is why we cut through the noise and pulled together the seven marketing dashboard tools worth exploring.
1. Funnel
Funnel isn’t just a dashboard tool; it’s the foundation that makes dashboards trustworthy. With 500+ always-maintained connectors, automatic data harmonization and unlimited users, it eliminates the chaos of fragmented spreadsheets and broken APIs.

Funnel’s marketing dashboard templates bring together all your data sources so you can track your marketing efforts and key metrics in one place.
Unlike other platforms, Funnel powers dashboards and offers advanced measurement capabilities like MMM, incrementality testing and data-driven MTA attribution. This makes it the category leader: the tool other dashboards depend on to deliver real value.
Who is Funnel best for?
Funnel is suited to in-house and agency marketing teams that need a reliable way to consolidate and report on marketing performance data. It brings together information from all marketing channels, then allows users to create custom dashboards to track KPIs and visualize results. Data can also be shared with external platforms such as Looker or Power BI, making it a fit for teams working across different reporting environments.
What are its key differentiators?
- Stability: Funnel stores marketing data and displays it in a no-code platform. The Data Hub stores historical data without limits, so you don’t have to worry about data loss if an API connection breaks.
- Frictionless data exploration: While many analytics tools emphasize design, Funnel allows users to go further than static charts by drilling into data when more detailed exploration is needed.
- End-to-end solution: The platform offers a wide range of data connectors, removing the need for manual imports. Teams can set up dashboards and let Funnel manage the data pipeline.
- Automatic normalization of marketing data: Funnel cleans and transforms data so reporting stays consistent. Conversions such as currency adjustments and metric alignment are handled automatically, creating a smoother reporting process.
- Multi-client management: Agencies benefit from easy client onboarding, built-in reporting templates, secure client portals for easy sharing and roll-up reporting across accounts.
What are the pricing options and plans?
Funnel offers a Starter plan designed for teams beginning to build reliable, automated marketing dashboards, with higher-tier plans available for organizations that need advanced measurement and scalability.
Here’s a table comparing Funnel against the other tools in the list to help you compare as you go:
Funnel vs. competitor marketing dashboard tools
|
Tool |
Who it’s best for |
Key differentiators |
|
Funnel |
Marketing teams that need reliable reporting without technical overhead |
Stability (no code dashboards that keep working even if a data source fails), exploration beyond static charts with full drill down, end-to-end coverage with hundreds of data connectors and automatic data normalization, including currencies and metrics. |
|
Looker BI |
Enterprises with complex data systems and specialist BI teams |
Strong data modeling with LookML and semantic layer, but it’s better suited for technical users than marketers. |
|
Looker Studio |
Beginners or small teams already using Google products |
Easy drag and drop builder and native Google integrations but lacks advanced modeling and drill down. |
|
Databox |
Time-poor teams who want quick templates rather than custom dashboards |
Large template library and KPI scorecards, but there’s limited flexibility. |
|
Klipfolio |
Teams that want custom dashboards with some coding capability |
Role-based access controls and wide integration reach, but the platform can slow down with complex builds. |
|
Tableau |
Data-heavy teams with analysts focused on deep BI projects |
Powerful visualization and AI analysis, but it can be slow with complex calculations. |
|
Whatagraph |
Agencies reporting to clients on campaigns and email marketing |
White label reports and live sharing, but expensive for small businesses. |
While every tool offers a way to visualize performance, only a few combine reliable data handling with scalability and ease of use. Each platform has its strengths and trade-offs when it comes to data quality, flexibility and automation. Here’s how they stack up in practice, starting with Looker BI.
2. Looker BI

Who is Looker BI best for?
Looker is built for enterprises with complex data environments and dedicated analytics teams. It excels at large-scale modeling, governance and advanced analysis across departments like finance, operations and marketing.
What are its key differentiators?
- LookML enables deep, customizable data modeling.
- Semantic layer maintains consistent metrics and governance.
- Predictive analytics delivers a unified performance view.
- Integrates with Google Cloud, BigQuery, Snowflake and other SQL databases.
What are the pricing and plans?
Pricing for Looker is custom and depends on company size and usage. According to Explo, contracts often start around $60,000 per year, with larger enterprise deployments running higher. Costs rise with more users, data volume and features.
How does it differ from Funnel?
Looker BI is built as a business intelligence powerhouse, not as a marketing-first tool. Setting it up and maintaining it takes technical know-how, so most teams rely on data engineers to get value from it. Funnel takes a different approach. It’s designed for marketers to bring all their data together, standardize it automatically and dig into insights without needing to write code or manage a BI system.
3. Looker Studio

Who is Looker Studio best for?
Looker Studio is the lighter, more accessible sibling of Looker. Formerly Google Data Studio, it focuses on dashboarding rather than heavy-duty BI. It is best for marketers and small teams who want to create clear, customizable dashboards quickly, especially if they already use Google products.
What are its key differentiators?
- Drag and drop dashboard builder that is easy to learn
- Native integration with Google Analytics, Google Ads and other Google tools
- Flexible enough to connect to social platforms and third-party data sources
- Collaboration features for sharing dashboards across teams
What are the pricing and plans?
Looker Studio has a free version that covers most needs for individuals and small teams. For more advanced features, Looker Studio Pro is available at $9 per user per month. Additional costs may apply if you need third-party connectors.
How does it differ from Funnel?
Looker Studio is all about visualization, making it a good option for quick, attractive dashboards. But it does not clean, normalize or transform your data, which means reporting can get messy when working across multiple sources. Funnel not only prepares and harmonizes the data but also integrates directly with Looker Studio. Using Funnel with Looker Studio lets you seamlessly build dashboards using data that is already consistent, reliable and ready to use.
4. Databox

Who is Databox best for?
Databox is built for time-poor teams and agencies that want quick, ready-made performance reporting. It helps track campaign metrics and engagement across multiple platforms without building dashboards from scratch.
What are its key differentiators?
- Large library of prebuilt dashboard templates
- KPI scorecards that monitor daily, weekly or monthly results
- SQL integrations and a drag-and-drop formula builder for custom metrics
What are the pricing and plans?
If purchased annually, monthly pricing is as follows:
- Professional: $159 per month for three data sources and unlimited users.
- Growth: $399 per month with advanced filtering, forecasting and AI summaries.
- Premium: $799 per month for up to 100 data sources, 15-minute syncs and dedicated support.
Features that come standard in other tools are paid add-ons with Databox:
- Extra data sources available for purchase
- 15-minute sync upgrade for selected sources
- White labeling and custom branding
- Paid guided onboarding and consulting packages
How does it differ from Funnel?
Databox prioritizes speed and simplicity but offers limited customization and data control. Funnel delivers the same ease of setup while automatically cleaning and normalizing data for deeper analysis and consistent, trustworthy reporting directly in Funnel or in your chosen visualization tool.
5. Klipfolio

Who is Klipfolio best for?
Klipfolio suits teams that want flexible dashboards with more control over the layout and data queries. It’s popular with agencies and businesses managing multiple clients or dashboards that require role-based access.
What are its key differentiators?
- Custom dashboard builder with prebuilt charts and templates
- Data integrations with major marketing and social platforms, plus support for custom queries
- Role-based permissions to control stakeholder or client access
What are the pricing and plans?
Business plans start around $120-190/month (annual billing). Agency-type plans are higher.
How does it differ from Funnel?
Klipfolio offers flexibility and control but often requires more setup time, manual coding and upkeep. Funnel provides the same reach across data connectors while automating cleaning, normalization and pipeline management so teams can focus on analysis rather than dashboard maintenance.
6. Tableau

Who is Tableau best for?
Tableau is built for teams that need deep analytics and powerful visualization. It works best when a dedicated analytics or BI team is doing the heavy lifting.
What are its key differentiators?
- Highly flexible and customizable visualizations
- Tiered licenses for Creators, Explorers and Viewers
- Built-in AI analytics and strong support for data prep and sharing
What are the pricing and plans?
- Creator license: $75 per user per month (annual billing)
- Explorer license: $42 per user per month
- Viewer license: $15 per user per month
- Enterprise add-ons like resource blocks and private connect
How does it differ from Funnel?
Tableau gives you a high-power BI environment but requires technical investment and ongoing management. Funnel automates the data prep, normalization and connector work, so marketing teams can build reliable dashboards without needing a full BI stack. Funnel even offers a dedicated Tableau connector so you can pipe clean and harmonized marketing data straight into Tableau, no manual ETL required.
7. Whatagraph

Who is Whatagraph best for?
Whatagraph is built for marketing teams and agencies that need polished, brand-ready marketing reports without the effort of building dashboards from scratch.
What are its key differentiators?
- AI-assisted report builder for faster setup
- Drag-and-drop widgets and templates
- Automated sharing through live links or scheduled emails
- White-label branding and custom domains
- Flexible pricing based on connected data sources
What are the pricing and plans?
You can start for free with Whatagraph, adding on features and credits as you go. Their paid tiers start at $229 per month (billed annually). They also offer custom agreements for enterprise-level needs.
How does it differ from Funnel?
Whatagraph focuses on presentation and speed, making it easy to produce professional-looking client reports. Funnel goes further by cleaning, mapping and standardizing marketing data before visualization. This ensures dashboards not only look polished but also reflect accurate, actionable insights teams can trust.
And unlike Whatagraph, Funnel also offers far broader data coverage. With 500+ always-maintained connectors (plus custom connectors built in-house), Funnel can unify virtually every marketing source in your stack. This breadth ensures your dashboards and reports reflect the full picture — not only the channels a visualization tool happens to support.
Current trends in marketing dashboards
Dashboards are evolving as fast as the marketing landscape itself. From AI copilots to privacy-first compliance, the tools you choose now will shape how quickly you can act on data in the future. Here are the shifts you should be watching.
AI takes center stage
AI is reshaping how dashboards work. Gartner predicts that by 2027, half of all business decisions will be powered or automated by AI. That shift raises the stakes for data quality. AI systems can only produce reliable insights when they’re fed clean, consistent and connected data.
A marketing intelligence platform makes that possible. It centralizes data from every channel, applies automated validation and ensures that what feeds your AI is accurate from the start.
Without that foundation, automation becomes noise instead of intelligence.
Predictive analytics become the default
MarketingProfs reports that predictive models are now actively shaping campaign strategy by reallocating budgets in real time and exposing where returns will be highest. Predictive analytics and machine learning help teams look ahead, forecast pipeline and adjust spend faster to cut waste and improve ROI.
Funnel supports this shift with AI-assisted analytics for scenario planning and its Quick Explore tool that lets marketers test ideas instantly. Together, they help marketing teams anticipate change instead of reacting to it. Clean, reliable marketing data also gives your predictive models a foundation you can trust.
Privacy-first reporting defines trust
As The Verge reported, Google has scrapped its plan to remove third-party cookies in Chrome and shifted to a user-choice model. Even so, first-party data strategies remain essential for marketers who want to stay compliant and maintain reliable performance data.
According to CMS, by March 2025, regulators had issued 2,245 GDPR fines totaling €5.65 billion (about $6.1 billion USD), proving that compliance is no longer optional. Using a marketing intelligence platform built for privacy enables teams to work with non-personal first-party data while keeping audit trails intact. That means you can focus on analysis and decision-making instead of navigating regulatory risk.
Data quality moves to the front line
Dirty marketing data is a drain on your team and budget. A recent study by Dategence found that US employees spend around 540 hours a year fixing bad data, costing organizations $24,000 per employee annually.
A marketing intelligence platform solves data quality issues at the source, so every visualization is accurate, consistent and trustworthy.

Taken together, these shifts make one thing clear: a dashboard on its own is no longer enough. The winners in 2025 and beyond will be platforms that combine AI, predictive insight, privacy safeguards and clean data foundations in one place.
Funnel is built for marketers who need dashboards that reflect reality. It unifies and cleans data from every channel so visualizations are accurate and consistent, not cosmetic. By solving data quality at the source, Funnel turns dashboards into the front end of true marketing intelligence where measurement, attribution and predictive insights all build on a single trusted foundation.
How to analyze your marketing data
Even the best dashboard tool won’t deliver insights if the underlying process is weak. Analysis is about asking the right questions in the right order. Here’s a simple framework you can use to get started.
1. Define your core KPIs before you open a dashboard
Start with the metrics that connect directly to business outcomes, such as customer lifetime value, customer acquisition cost and return on ad spend. If you’re unclear on what success looks like, no visualization will fix it. Strong attribution foundations help you choose KPIs that reflect real impact, not noise.
2. Consolidate your data sources
Fragmented data slows decision-making and hides performance gaps. Combine campaign, web analytics and CRM data in one trusted location so every team works from the same numbers instead of cross-checking spreadsheets.
Funnel ingests data from all your marketing sources, from analytics and paid media to social, giving you a central hub that’s secure and scalable.
3. Clean and normalize your data
Consistent data is the foundation of trustworthy dashboards. When naming conventions vary, currencies shift and time zones clash, dashboards may look polished but deliver flawed conclusions. Instead of wasting hours on manual fixes every week, marketers need a platform that automates cleaning and normalization so reports reflect reality, not confusion.
Agencies like Publicis Sweden have cut reporting time by 90% with Funnel, freeing teams to focus on strategy instead of spreadsheets.
4. Build dashboards that answer questions, not just display numbers
Dashboards should reveal causes, not just outcomes. Go beyond static charts by designing views that explain why campaign performance changed and what to do next. Build role-specific dashboards so CMOs, channel owners and finance each see the granular insights that matter most to their decisions.
Strong data storytelling turns metrics into a narrative that supports strategic discussions and justifies budget shifts.
5. Automate reporting wherever you can
Replace manual reporting with scheduled, automated updates that pull data directly from your sources. Set clear refresh intervals, automate recurring dashboards and use alerts to flag performance changes as they happen.
This keeps insights current, reduces human error and gives your team more time to analyze results and test new strategies instead of rebuilding the same reports each week.
6. Apply advanced models when you’re ready
Once your data foundation is solid, build predictive power into your dashboards. Start with marketing mix modeling to see how each channel drives results over time, then layer in other techniques to uncover the key variables influencing performance. Use scenario planning to test budget scenarios and estimate ROI before spending.
These models turn dashboards from static reports into planning tools that guide smarter, evidence-based investment decisions.
Key takeaway: Dashboards make data visible, but only a disciplined process makes it valuable. Follow these six steps and you’ll spend less time fixing data and more time acting on it.
Get marketing intelligence. Not just dashboards.
Dashboards alone won’t win the next quarter or win over your clients. What matters is the intelligence behind them: clean, reliable and privacy-ready data that fuels every decision from campaign tweaks to boardroom strategy. That is why the most advanced in-house and agency teams are shifting focus from pretty charts to platforms that deliver true marketing intelligence.
Funnel’s Marketing Intelligence Platform does exactly that by centralizing, cleaning and connecting your data to any dashboard or analytics tool you choose. It also offers important features for client reporting, including data control and scalable insight sharing, helping agencies scale while offering their clients the insights they need to move forward. Make 2026 the year you move from reporting to real intelligence. It all starts with Funnel.