






Every marketing team wants to answer this question: where should the next dollar go?
It sounds simple, but most teams don’t have a confident answer. And when resources are tight, every dollar in your marketing budget matters more. However, most teams rely on historical averages and past performance to guide future marketing budget allocation decisions.
The problem is that these data points hide the most important signal: where additional spend will produce the highest incremental return.
That signal lives inside the concept of marginal performance, and it’s something modern measurement frameworks are built to reveal.
The question every marketing team asks: where should the next dollar go?
Whether during annual planning, marketing strategy meetings, a mid-year marketing budget optimization session or a budget increase request, the same question surfaces:
“Where should the next dollar go?”
This question can show up in conversations that may sound like:
“We have an extra $50,000 this quarter. Where do we put it?”
“Which digital marketing channel should we scale next?”
The conundrum is all too common. Funnel’s 2026 Marketing Intelligence report found that 86% of in-house marketers and 79% of agency marketers struggle to determine the impact of each marketing channel on overall performance. This makes sense because the budget question is really a measurement question in disguise:
“What does our measurement tell us about where the next dollar should go?”
When answering this question to figure out marketing spend allocation, teams typically default to one of a few approaches that feel logical but can be misleading:
- Repeat what worked last year.
- Fund the channel with the highest reported return on ad spend (ROAS) or the lowest customer acquisition cost (CAC).
- Give more budget to whoever asks for it with the most convincing deck.
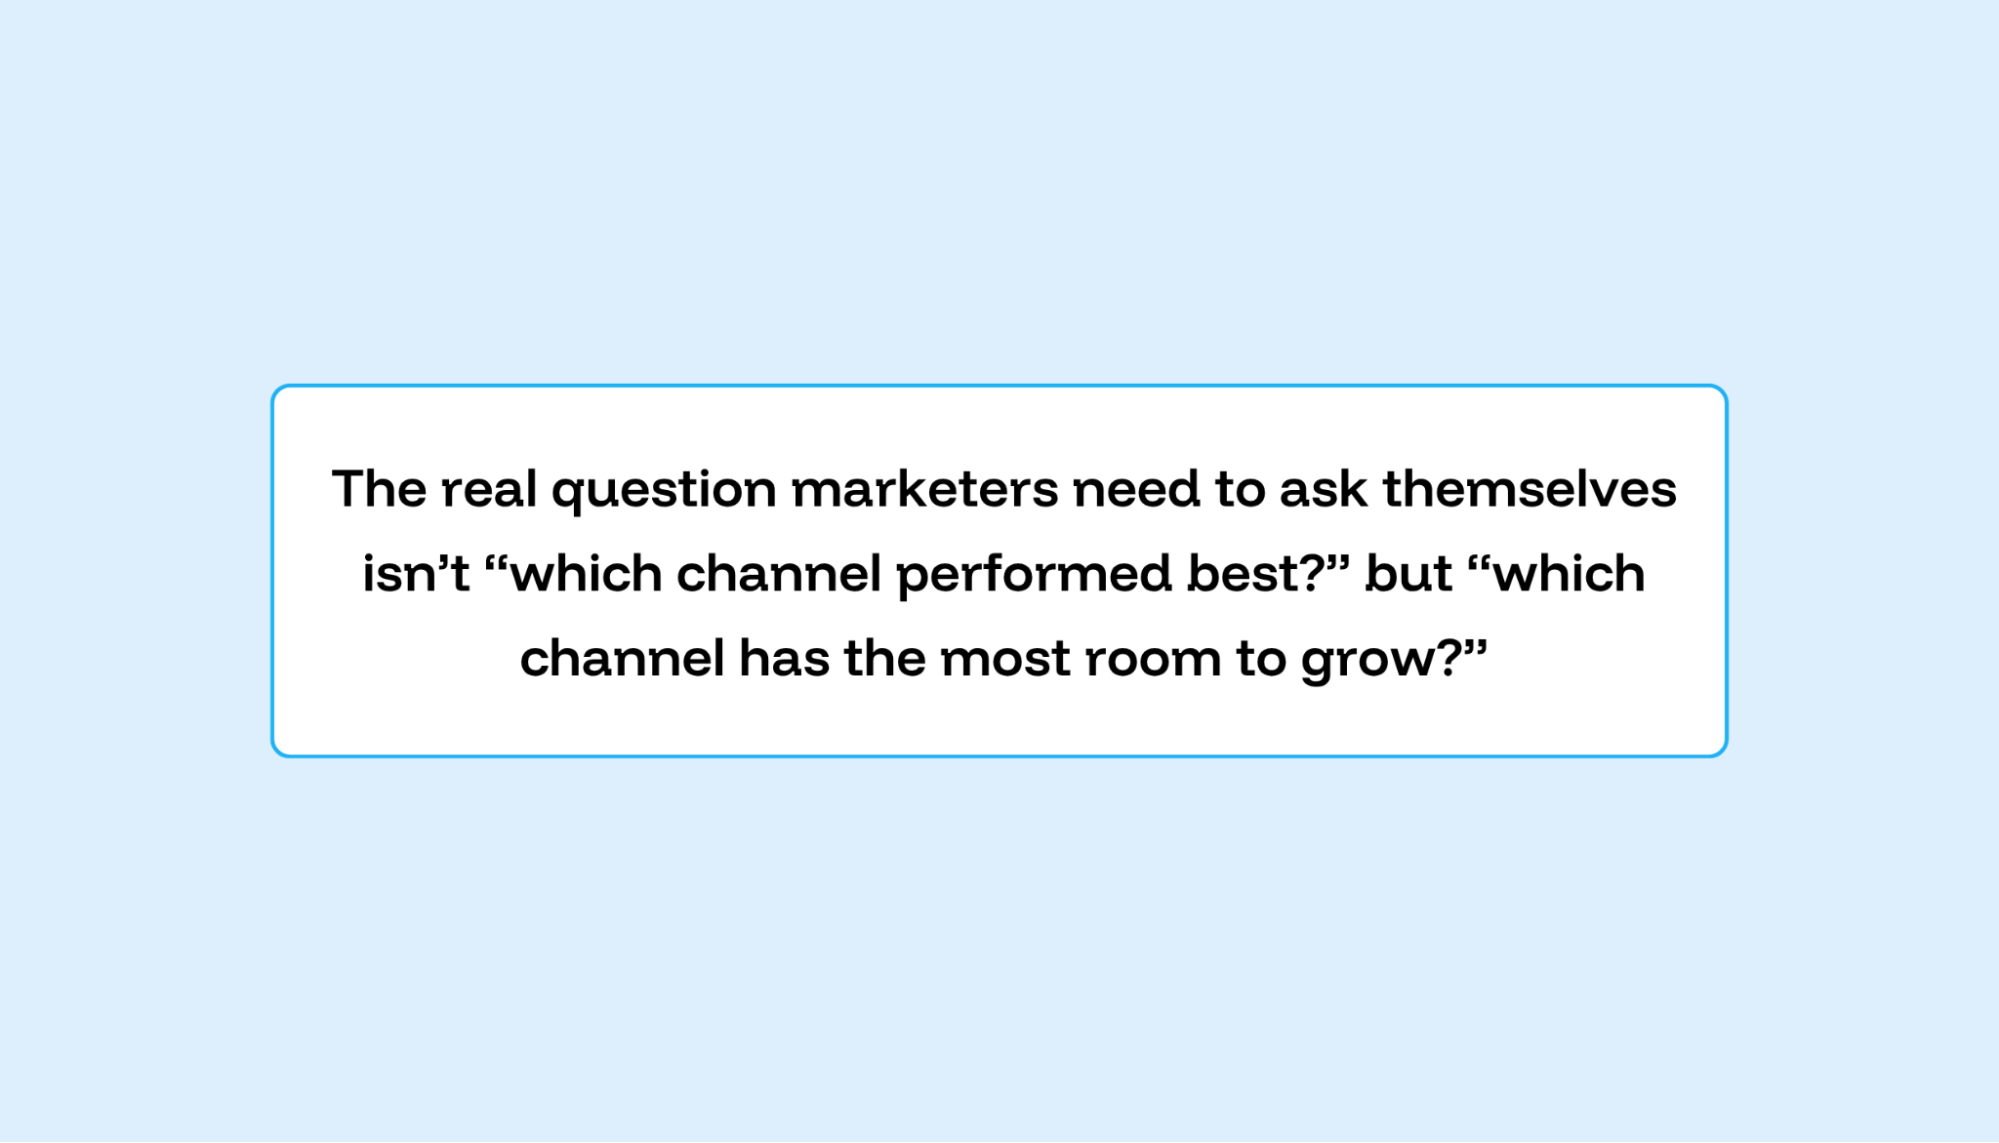
However, none of these approaches account for how the value of additional spend changes depending on how much you’ve already invested. With this in mind, the real question isn’t “which channel performed best?” but “which channel has the most room to grow?”
And the measurement method that answered the first question won’t always answer the second.
Why is this question so hard to answer?
The difficulty comes from a few compounding factors that make intuition unreliable.
Every channel has a saturation point
Most teams assume that if a marketing channel returned $5 for every $1 spent at the current budget, it will return twice this amount at double the budget. They expect $10 for every $2 spent.
But marketing returns aren’t linear, and every channel, whether that’s paid advertising or traditional advertising, has a saturation point. How close you are to that point determines how productive additional budget allocation to that channel will be.
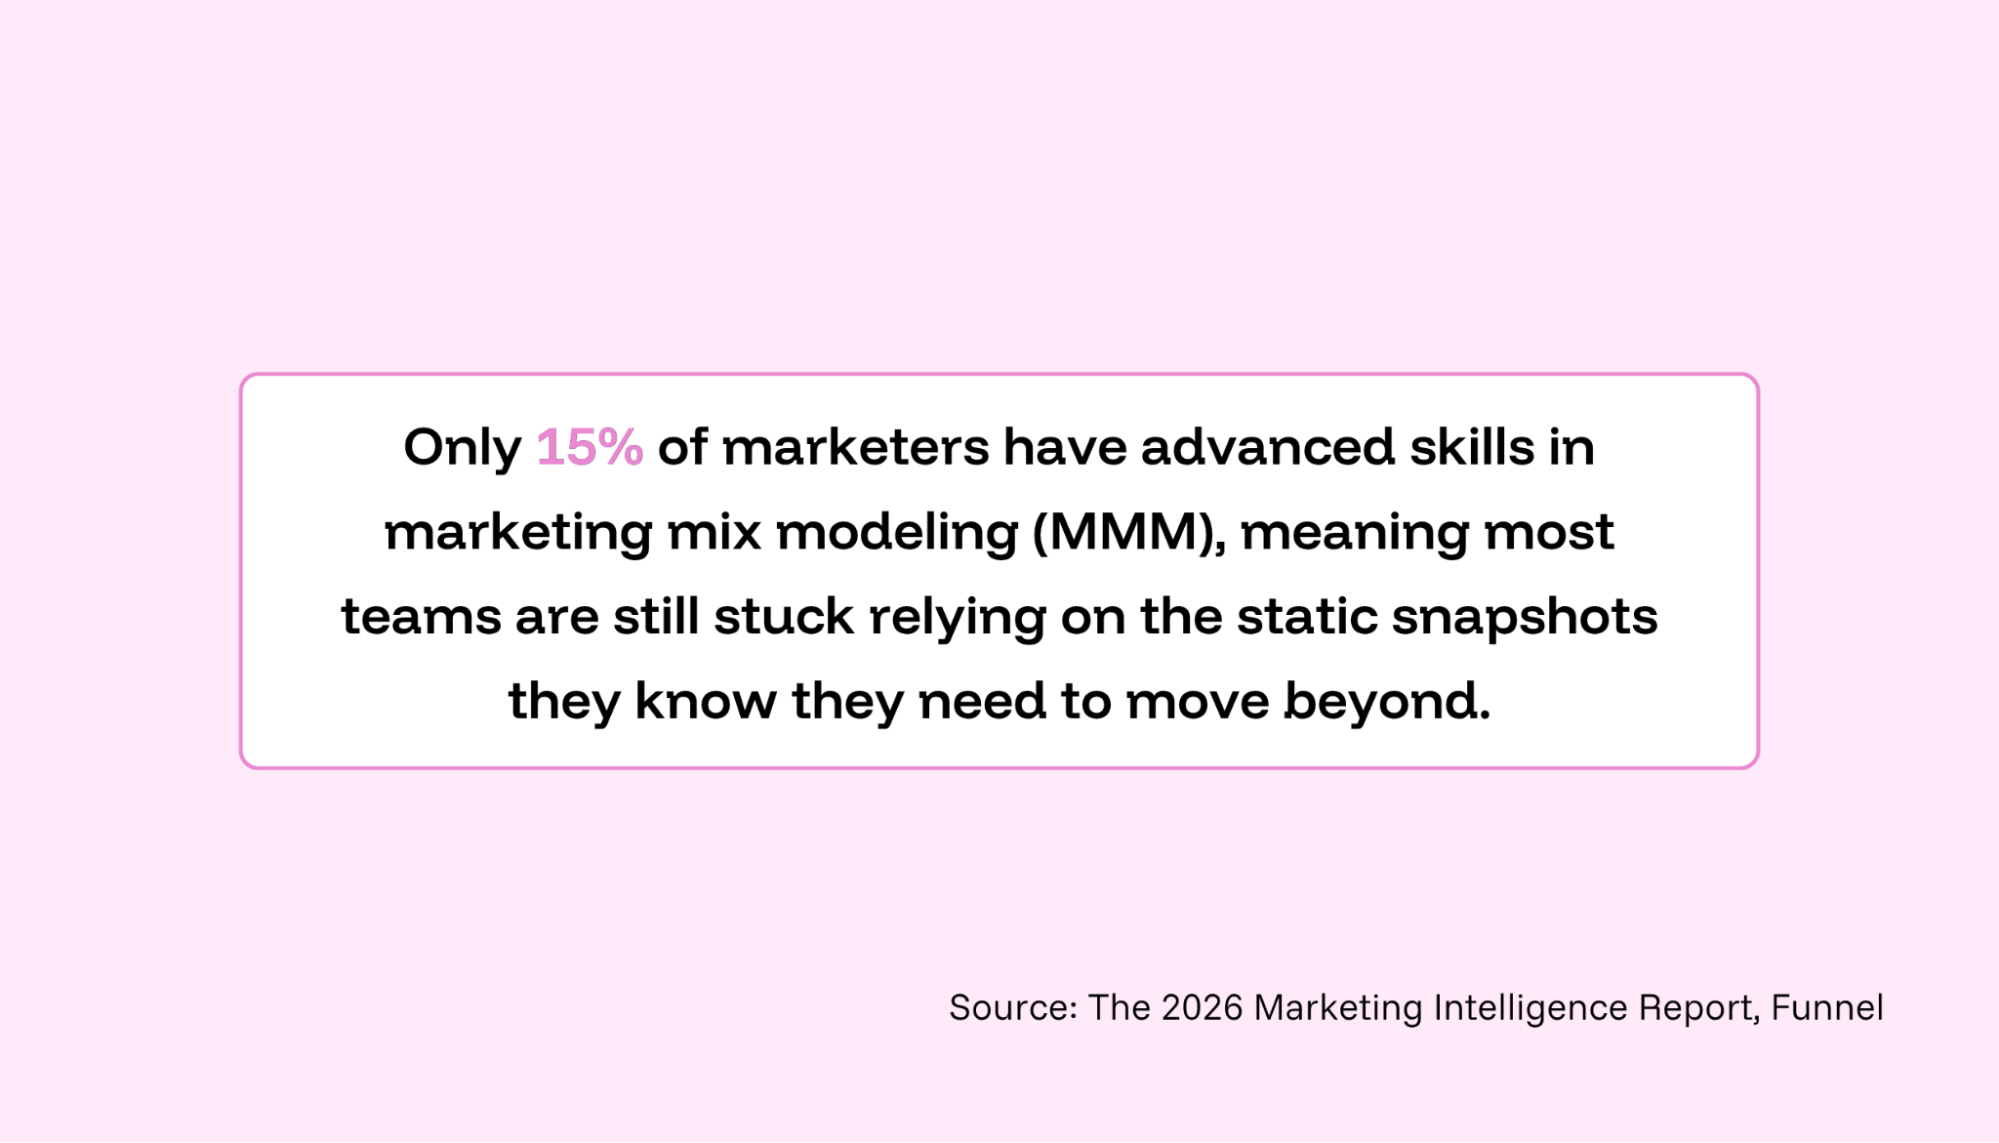
Funnel’s 2026 Marketing Intelligence Report found that just 15% of marketers have advanced marketing mix modeling skills, which is part of the capability needed to identify saturation points and understand when additional spend stops paying off. This means too few teams are equipped with the data they need to figure out when they’ll hit diminishing returns. At that point, additional marketing costs remain just that: costs, not investments.
The data you have doesn’t always answer the question you’re asking
Platform-reported metrics like return on ad spend (ROAS) and cost per acquisition (CPA) describe average historical performance. In other words, they tell you what has already happened. However, they don’t tell you what the next dollar will do.
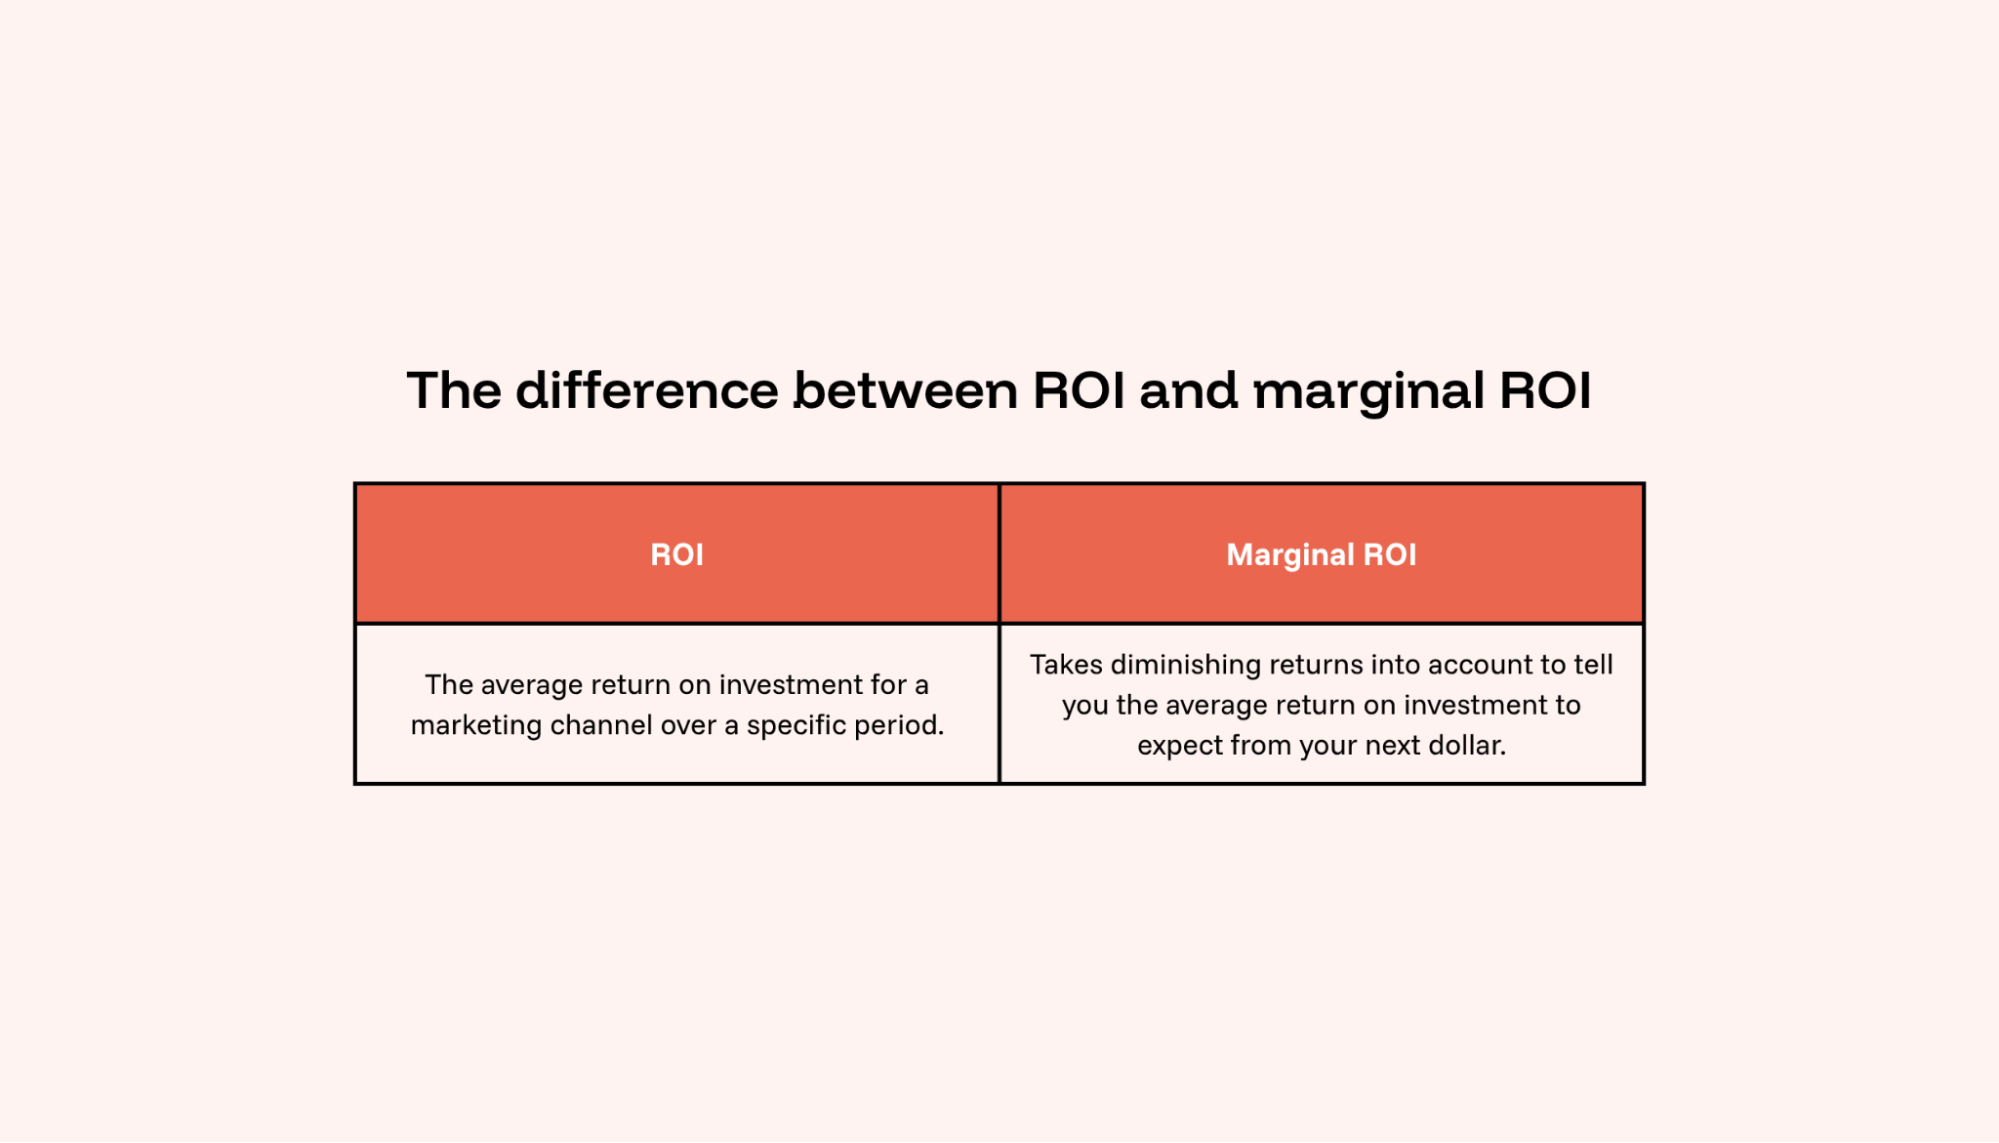
Marginal marketing ROI is what shows you how the next dollar will perform. Unfortunately, most platform-reported metrics don’t track it. And because of saturation points, it’s unlikely the next dollar will perform exactly like the last.
Marketing channels interact with each other
Marketing channels don’t operate in silos. A brand awareness campaign may lift the conversion rate of a search campaign, but that lift won’t appear in either channel’s standalone metrics. The marketing objectives for these two campaigns aren’t the same, but both digital marketing strategies have an influence on conversions.
Without measurement that accounts for these interactions, you may end up overfunding certain marketing efforts that capture demand and underfunding channels that create it. In the above example, increasing the budget allocation on the paid search campaign while cutting the spend for the brand awareness campaign would likely reduce the effectiveness of the former. But you’d never know that without the right measurement framework in place.
How diminishing returns change the value of additional marketing spend
The concept of diminishing returns in marketing is borrowed from economics. As you increase investment in a single output, each additional unit produces progressively smaller results.
In marketing, early dollars in a channel tend to reach the most receptive audiences at the lowest cost. But as spend increases, you exhaust those audiences, and costs rise as a result.
Here’s an example. Let’s imagine you’re spending $10,000 on a paid social campaign and generating $50,000 in revenue. This is a 5x return on investment. Since these marketing efforts are going so well, you double the budget to $20,000, and revenue goes to $80,000. That’s a 4x return.
The first $10,000 delivered $50,000, but the second $10,000 delivered only $30,000. That’s $20,000 less. The average ROAS across the full $20,000 is still a strong 4x, but the marginal ROAS on that second $10,000 was only 3x.
If the team had put that second $10,000 into a different channel with a higher marginal return, total revenue from the same digital marketing budget would have been higher. The idea here isn’t that a 4x return is bad. It’s that your marketing initiatives could be more successful when taking marginal returns into account.
Why averages are misleading
You can operate at a good ROI, but you still might be wasting your marketing dollars that you could use more efficiently elsewhere. A channel can look strong while the last dollars invested are producing almost nothing.
This is why asking which channel has the best ROI is the wrong question when deciding where to invest additional budget or picking which digital marketing strategies to try next. The right question is:
Where will the next dollar produce the highest incremental return and achieve the best business growth?
Why historical performance doesn’t predict future efficiency
You can’t focus on historical performance alone when you create a marketing budget. Last year’s results describe conditions that may not hold. Audiences shift, competitors change their spend, platform algorithms update and external factors like seasonality and the economy reshape the landscape.
Even the lag between when a customer first sees an ad and when they convert can change, meaning the funnel dynamics your model captured six months ago may already be outdated. A channel that delivered strong results at a certain spend level may already be saturated at that level and start producing diminishing returns.
This is what makes annual marketing mix models challenging. Modern measurement models address this by updating continuously, refreshing with new data to reflect current conditions rather than relying on a static annual snapshot.
When models stay current, they account for the way market dynamics, competitive activity and changing consumer behavior affect the relationship between spend and outcomes.
Measurement methods that reveal marginal performance
Three measurement approaches work together to answer the incremental investment question. These are marketing mix modeling (MMM), incrementality testing and triangulation.
Marketing mix modeling maps the big picture
Marketing mix modeling uses historical data to estimate the relationship between marketing budget decisions and business outcomes across channels. Its most important output is the response curve, which is also called the saturation curve or diminishing returns curve. This curve shows how the effectiveness of your marketing spend changes as investment increases.
Response curves reveal the difference between average and marginal performance, so that you’re aware of what the next dollar will produce. This allows you to spot where additional investment will drive growth versus where it’ll be wasted.
Incrementality testing validates the model
While MMM shows what should work based on historical patterns, incrementality testing proves what actually works today through controlled experiments. This means you’re making an educated hypothesis based on your model’s data and then validating this hypothesis.
Incrementality tests divide an audience into two groups: one that sees a paid ad, and one that doesn’t. Then, it measures the difference in outcomes. This isolates the causal lift of a campaign from demand that would have existed regardless of your team running this paid ad.
Triangulation ties it together
No single measurement method captures the full picture, even when used to its maximum capacity. This is where triangulation comes into play.
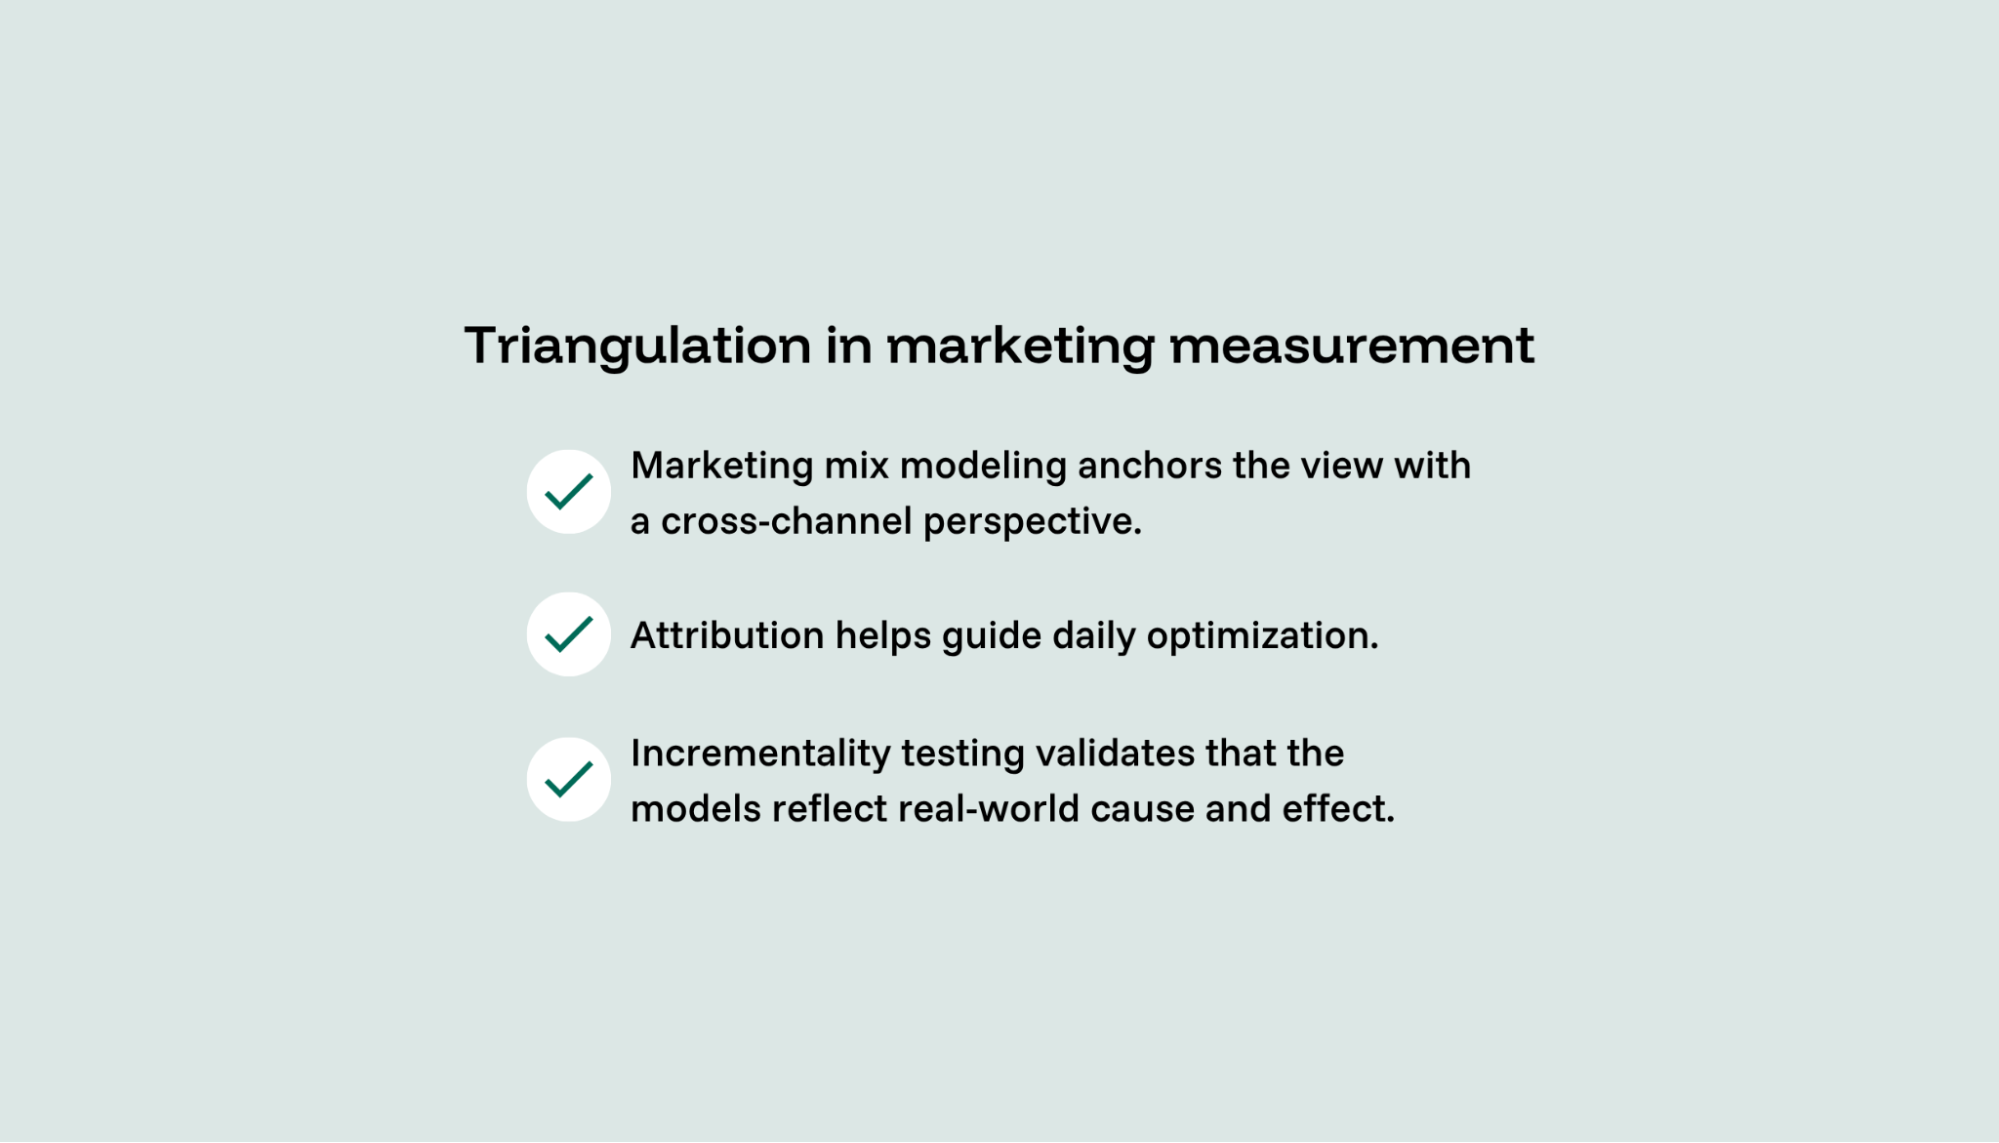
Triangulation combines MMM, multi-touch attribution and incrementality testing so that each of these three pillars mitigates the other’s weaknesses. The result is improved clarity on the whole picture.
Here’s how every element plays a role. Marketing mix modeling anchors the view with a cross-channel perspective. Attribution helps guide daily optimization. Finally, incrementality testing validates that the models reflect the real-world cause and effect of your marketing campaigns. Together, they give you the measurement data you need to make smarter budget allocation decisions.
How response curves reveal where channels are saturated
Response curves are the bridge between measurement and budget action. They plot your marketing spend on one axis and business outcomes, like revenue or conversions, on the other.
This shows the nonlinear relationship between your actual spending and the outcomes of your marketing campaigns.
As the Agile Brand Guide explains, these curves generally fall into three phases:
- An accelerated phase at low spend where returns are strongest
- A diminishing returns phase where each additional dollar produces less
- A plateau phase where additional spend produces almost no additional outcome
Let’s cover how to read a response curve to get the most accurate interpretation.
How to read a response curve
If a channel’s current spend sits in the accelerated phase, it has room to scale. As such, any additional investment is likely to be productive. If it’s near a plateau, further investment will be inefficient, and a smarter marketing budget plan would be to spend the next dollar elsewhere.
Bottom-of-funnel channels like brand search tend to saturate quickly since they target small, high-intent audiences. On the other hand, upper-funnel channels typically have longer runways before diminishing returns set in.
That being said, this may vary for each brand, so use your best judgment based on what your response curve tells you and align marketing spend based on that.
Marginal ROI connects the curves to action
When you know where each channel sits on its response curve, you can compare the marginal return of the next dollar across all channels. The equimarginal principle says that to maximize total returns, you should invest more in whatever marketing channel has the highest marginal return until marginal returns equalize across channels.
Apply this principle to all your digital advertising efforts, and you’ll make much faster headway toward achieving business goals like increasing revenue and driving more sustainable growth.
How to turn measurement insights into marketing budget allocation decisions
Having a measurement system in place doesn’t automatically lead to better decisions for strategic budget allocation. Teams need a process to translate insights into action that moves the needle toward business objectives.
Start by identifying channels where marginal returns are significantly higher or lower than your team expected for given marketing expenses. These represent the lowest-hanging fruit for reallocation.
When you have additional budget to deploy, response curves point to the channel with the most headroom. When you need to cut, they point to the channel closest to saturation where the marginal return is the lowest.
Scenario planning makes this practical. Try modeling what happens if you shift 10% of the budget from a saturated channel to one still in its growth phase. From there, compare the projected outcomes.
Your measurement system should be continually validated against real results, and you should use incrementality tests periodically to confirm that the model’s predictions hold in practice. Over time, this creates a feedback loop in which measurement informs the plan, results validate the model and each cycle improves the next decision.
In other words, each “next dollar” you invest will become more effective, allowing you to get closer to succeeding with business objectives.
Find your next best dollar to scale with ease
Finding the next best dollar is one of the most important questions a marketing team can ask, and one of the hardest to answer without the right measurement in place. Averages hide the truth. Past performance fades in relevance. And a marketing budget based on gut instinct doesn’t scale.
What works is understanding where each channel sits on its response curve, knowing the difference between average and marginal returns and using measurement frameworks that continuously reveal where additional investment will create the most growth.