
Marketers today face a never-ending challenge: proving that advertising is driving growth. You’re expected to justify strategy, defend budget and show a clear business impact. Yet with fragmented data, platform-reported metrics and incomplete attribution, it’s becoming difficult to answer that critical question: what results did your marketing actually cause?
Advertising incrementality changes the conversation.
Instead of guessing which results your marketing efforts caused, measuring incrementality isolates the true lift created by your campaigns. Once you understand the incremental impact, you can optimize advertising spend, justify marketing budgets and make decisions that drive results.
This guide breaks down what advertising incrementality is, how to measure it and when to use it.
What is advertising incrementality?
Advertising incrementality is the practice of measuring the additional impact your advertising has on business outcomes compared to what would have happened without that advertising. It isolates the true causal effect of a campaign, channel or tactic.
In practice, it helps determine whether a specific channel or campaign actually drove new sales or actions that would have otherwise not occurred. A ‘control versus test’ approach is the best way to determine the incremental effects of a marketing action on a result.
Some sales happen regardless of whether ads are running. They’re driven by existing demand rather than active marketing. For example, a sale might occur because of any of the following:
- Brand awareness built over time
- Loyal customers or word of mouth
- Organic search (SEO investment) and non-paid channels
These are the sales that happen because your brand has gained a trusted position in the market over time. Loyal buyers already know how to find you, whether or not you run ads.
These non-incremental results give you your baseline performance, which is the reference point against which true advertising impact can be measured with incrementality tests.
What’s the formula for calculating advertising incrementality?
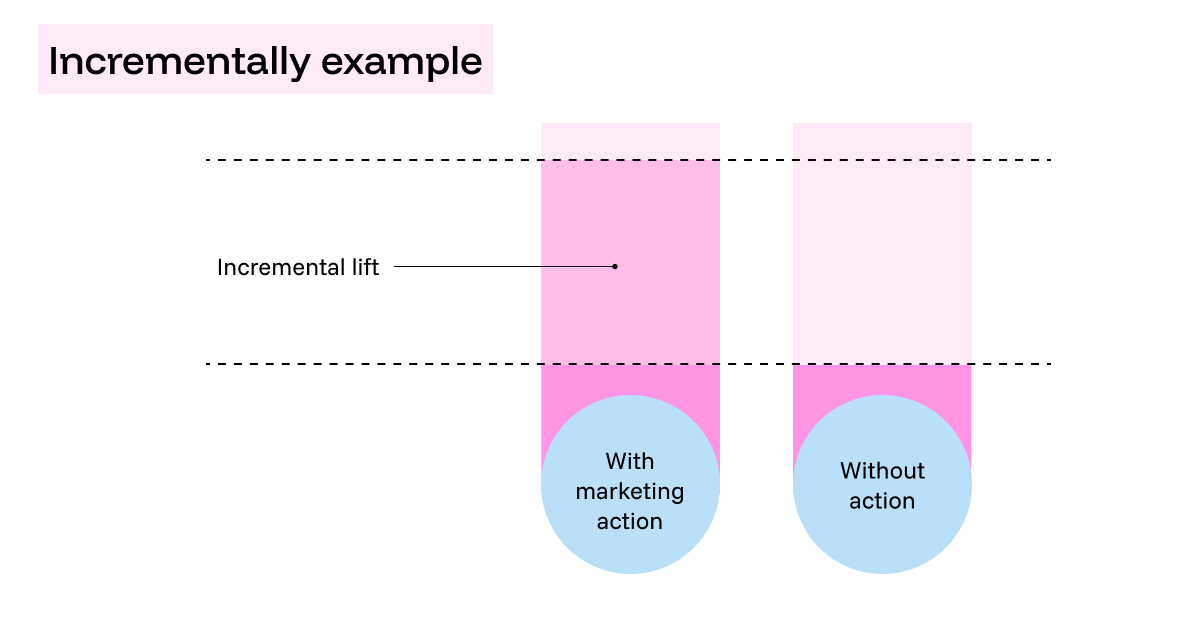
Calculating incrementality comes down to a simple comparison between two groups: one exposed to advertising (test group) and one that’s not (control group).
To calculate advertising incrementality, choose a specific outcome, such as webinar signups or revenue. Then, measure the outcome for the test and control groups. The difference between them represents the incremental impact of the campaign or channel you’re testing.
Incremental lift shows the additional outcomes generated, such as extra conversions or more sales. You can also look at the relative uplift. Relative lift puts that difference into context by showing the percentage increase over the baseline.
So, for example, if the test conversion rate for a new channel is 6% and the control conversion rate for an existing channel is 4%, the relative uplift is 50%.
- (6 - 4) / 4 = .50
- Multiply .50 by 100 to convert into a percentage: 50%
The clarity that comes from measuring advertising incrementality helps teams move past surface-level metrics and focus on whether ads are actually creating incremental value.
How does incrementality work in practice?
Imagine you’re running a Black Friday campaign across multiple marketing channels. With incrementality measurement, you compare a group exposed to Instagram ads with a comparable group that isn’t. Without incrementality measurement, it would be difficult to determine which sales would have happened anyway as part of the usual seasonal shopping trends.
Using this control-and-test approach, you can understand marketing impact at a more granular level. For instance, you can figure out if your display ads or social media posts are really contributing to an uplift in your YOY holiday sales.
The goal is clear: identify which campaigns and channels are truly driving sales, and which results would have happened regardless of advertising.
Why does marketing incrementality matter?
Incrementality helps separate the results that you would have achieved anyway from those that were caused by marketing efforts. Instead of relying on clicks or impressions to measure performance, it shows what is genuinely driving sales or leads.
Attribution models can be misleading when used in isolation. Last-click attribution tends to give all the credit to the last place a customer visited before they made a purchase, overlooking all the other marketing elements that might have made an impact on their decision-making process.
With incrementality, you get a more unbiased view of attribution, so you can more accurately assess which marketing efforts are generating real impact.
When marketing budgets are tight (which they often are), having incrementality in your toolbox means you're ready to prove to leadership where your spend is actually creating value and make smarter budget decisions.
Step-by-step guide to measuring advertising incrementality
Ready to leverage incrementality testing for quick, actionable insights? It starts with comparing with your baseline to create a comprehensive and robust overview.
1. Model your baseline sales
Before you can start testing, you need a baseline to compare against. This will make creating a holistic view of your results much simpler later on.
How to gather historical data
- First, collect sales and ad spend data across all marketing channels for a set period.
- Include other potential influencers like seasonality, economic factors and competitor marketing activity to create a full model.
2. Set up incrementality testing
Define your control and treatment groups
- Choose your platform (e.g., Facebook, Google Ads, in-store promotions).
- Identify a representative audience segment for testing.
- Choose campaigns with immediate calls to action (e.g., promotions, product launches).
Set up your campaign environment
- Create campaigns within your ad platform that allow you to isolate the test and control groups for online environments.
- Consider geographic split testing (different regions) or timing variations (specific days for ads) for offline or hybrid environments.
- For geo-lift incrementality testing, find two geographic regions in your audience that are similar.
- Then, pause all ads in one of these regions.
- After a few weeks, compare the regions to see how much less sales, if any, the region without ads is driving compared to those with ads.
- Avoid any other changes in marketing or promotions for the test duration to keep the comparison clean.
3. Run the incrementality test
Launch the campaign
- Run your campaign, showing the ad or marketing intervention only to the test group.
- Keep the control group excluded from any exposure to the test ad.
- You can use comprehensive tracking tools like a central data hub, ad platform pixels and customer relationship management (CRM) software to monitor responses from each group in real time.
Monitor data collection
- Track conversions for both test and control groups.
- You can use conversions like purchases, sign-ups, downloads or any specific action you want to measure.
- Confirm that each action is correctly attributed to the relevant group in your tracking setup.
- Track MTA so your interpretation can be more comprehensive and accurate.
- Gather data for a long enough period to capture reliable results (e.g., 2–4 weeks for short campaigns or several months for longer campaigns).
Calculating incrementality
While you might have a tool that will manage this all for you in a central Data Hub, it pays to understand the numbers you’re going to be working with and how to calculate incrementality on the fly.
Compare conversion rates
First, calculate the conversion rate for each group:

Let’s assume the following:
- Test group size: 2,000
- Test group conversions: 300
- Control group size: 2,000
- Control group conversions: 250
Step 1: Calculate the conversion rates
The test conversion rate is 300 / 2000 = 0.15 (15%)
The control conversion rate: 250 / 2000 = 0.125 (12.5%)
Step 2: Calculate the absolute difference
Find the absolute difference between the conversion rates to find the incremental lift.

Incremental lift for the conversion rate = 15% - 12.5% = 2.5%
Step 3: Calculate relative uplift
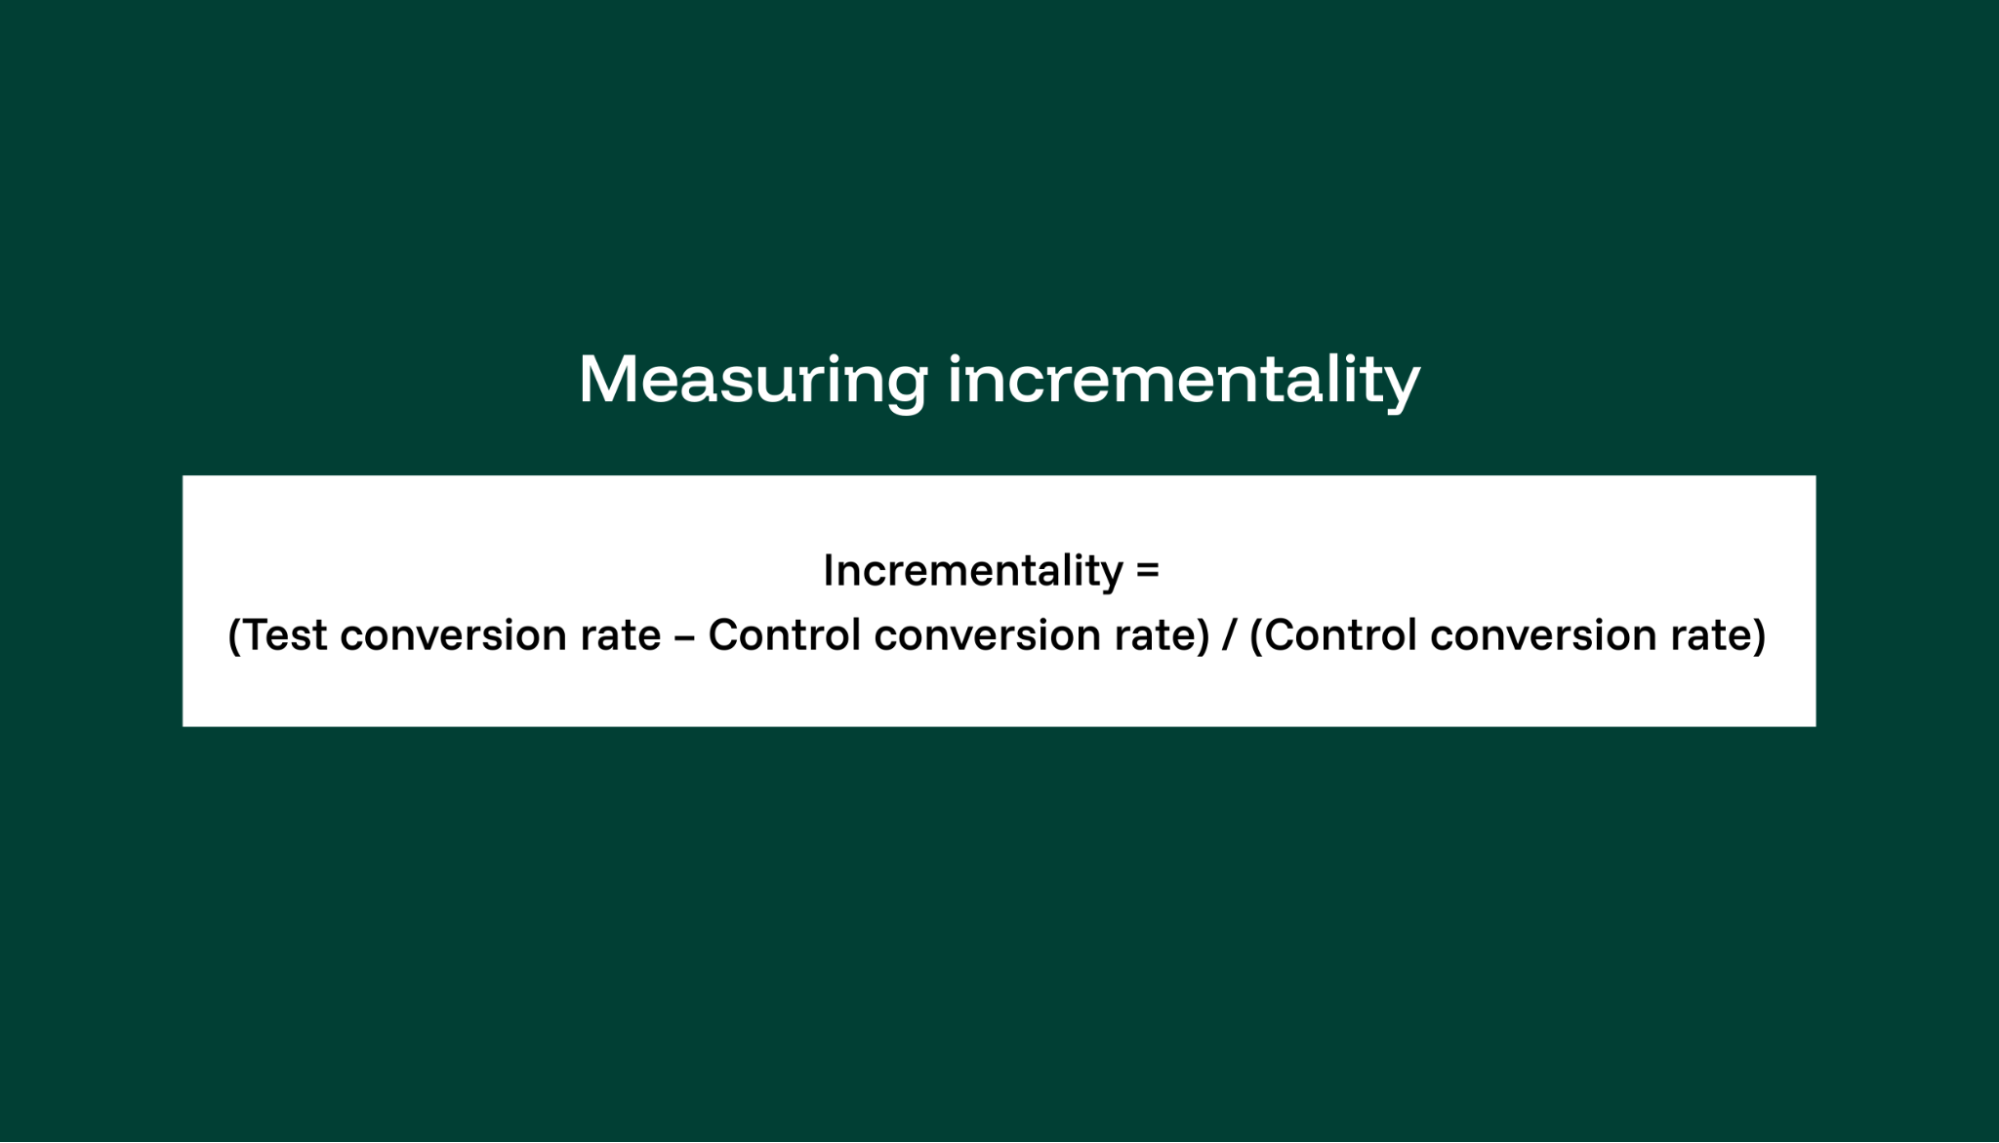
When your exec team asks you how much your tests improved sales, you can express it as relative uplift using our earlier mentioned formula for measuring incrementality:
(Test conversion rate - control conversion rate) / (Control conversion rate)
(15 - 12.5) / 12.5 = .20 (x100) = 20%
The relative uplift is 20%, meaning the test group's ad increased conversions by 20% compared to the control group. The absolute increase was 50 additional conversions, or an increase in the actual conversion rate by 2.5 additional percentage points
From these simple calculations, you can determine not only if your test was successful but also by how much.
Measuring incrementality is useful, but it’s not perfect. It’s important to understand where this measurement technique falls short so you can fill in the gaps with other types of marketing measurement.
What are common mistakes marketers make when measuring incrementality?
Here are some common pitfalls to avoid when measuring advertising incrementality.
1. Misinterpreting results
Incrementality tests show causal lift, but if the experiment isn’t designed correctly, results can be misleading. For example, testing too small a sample size or not accounting for seasonality can exaggerate or understate the true impact.
2. Overly narrow scope
Running incrementality tests on single channels or short campaigns gives useful but limited insights. Without combining results across channels, marketers risk making decisions in silos.
3. Short-term bias
Incrementality often focuses on immediate lift, which can undervalue campaigns with long-term brand impact (like awareness or upper-funnel media). This creates a bias toward tactics with fast, measurable outcomes.
4. Operational complexity
Designing, executing, and analyzing incrementality tests can be resource-intensive. If the process requires constant engineering or analyst support, it may slow down decision-making and frustrate teams.
5. Ignoring attribution context
Incrementality tells you what changed because of marketing, but not which touchpoints along the journey influenced the outcome.
6. False sense of certainty
It’s easy to treat test outcomes as absolute. But lift can vary across audiences, geographies, or time periods. Treating one test as a universal truth risks oversimplifying the complexity of marketing impact.
If incrementality only gives you a limited view, when should you use it, and what else can you use to widen your view?
When to use incrementality in marketing measurement, and when to use other techniques
Different marketing measurement methods answer different questions. No single method tells the whole story, so it’s important to understand what each one reveals.
Here’s how to choose which method to use based on what you’re trying to learn:
If you want to measure true causal impact, use incrementality testing
Incrementality testing isolates the impact of your marketing by comparing outcomes between an exposed group (marketing campaign) and a control group.
This approach works well for channel-specific evaluations, like measuring the lift from paid social or email campaigns. When attribution signals conflict or platform-reported conversions seem inflated, incrementality helps clarify what’s actually driving results. It’s all about knowing what moves the needle so you can better manage your marketing spend and drive real growth.
If you want to map the customer journey, use marketing attribution
Marketing attribution focuses on assigning credit to different touchpoints in a customer’s journey — showing how channels work together to drive a conversion. For example, attribution can show how paid search, display and email collectively influence a purchase, even if one channel appears stronger in isolation.
Teams can easily identify where they’re losing customers in the funnel and improve creatives, targeting or landing pages accordingly. Upper-funnel spend that often gets overlooked, like awareness campaigns, can be evaluated more fairly by looking at the full customer journey.
That said, attribution reflects who got credit, not necessarily who caused an incremental lift. On its own, it can overstate or understate impact. But when layered with incrementality testing and MMM, attribution provides the in-between context. It not only shows what drives results, but also how different touchpoints contribute to them.
If you want to identify long-term growth drivers, use MMM
Marketing mix modeling (MMM) gives you the macro truth. It helps uncover your baseline sales while pinpointing how much of your growth comes from your media and marketing campaigns. It’s a powerful way to identify what’s driving results so you can fine-tune your strategy.
MMM looks at trends over longer periods, so it’s great for understanding marketing-driven sales and channel-level contributions in a big-picture way. It also factors in seasonality, macroeconomic conditions and diminishing returns. Knowing these patterns helps teams make smarter budgeting decisions about how much to invest and where to invest.
However, MMM works best alongside tools like multi-touch attribution (MTA) and incrementality testing. When used together, these measurement methods provide a clearer picture of both immediate and sustained impact.
If you want the full picture, use triangulation
MMM, attribution and incrementality testing each provide different parts of the story, but combining them offers the juiciest insights into incremental lift. Together, they provide a more holistic overview of ad effectiveness.
High-performing teams triangulate measurement to reduce bias and build confidence in decisions. By cross-checking results across different approaches, teams can validate findings and spot inconsistencies before acting on them. Trustworthy measurement empowers better data-informed decisions about budget allocation.
Best practices for measuring incrementality
To get the most out of your incrementality tests, use high-quality, first-party data for accuracy, analyze cross-channel performance for depth.
Relying on first-party transaction data for accuracy
To measure incrementality accurately, it’s critical to rely on first-party transaction data rather than platform-reported metrics. If you pull data directly from your transaction history to assess campaign impact, it may not capture the full customer journey.
For example, an online fashion retailer segments customers into two groups. One receives SMS campaigns (exposed group), and the other doesn’t (control group). Using the sales data from their customer relationship management system (CRM), not data from the SMS tool, they can track conversions, average order value and purchase frequency over time.
By comparing these metrics between the test and control groups, they can see the incremental lift from SMS, isolating its impact from other channels like email and organic search.
This reveals whether SMS truly drives additional sales, allowing the retailer to make better-informed decisions about future SMS investments. This level of insight helps you manage budgets with greater precision, making justifying your ad spend that much easier.
Looking beyond platform lift studies for cross-channel insights
Platform-specific studies might only reflect single-channel campaign performance and overlook cross-channel interactions. But you can also use incrementality measurement to capture the interplay between channels.
Let’s say a fitness brand uses incrementality measurement to assess the combined impact of Instagram and YouTube ads on online course sales. First, they split the audience into three groups:
- One sees only YouTube ads
- Another, only Instagram ads
- And a third sees both in a set sequence (YouTube first, then Instagram)

Splitting groups for individual testing makes it easier to see incremental lift across channels.
By comparing conversion rates across these groups, the fitness brand finds that sequential exposure (YouTube followed by Instagram) boosts conversions by 40% over single-channel exposure.
This insight allows them to focus their budget on coordinated, cross-channel campaigns rather than isolated ones that don’t have as much bang for their buck.
How a reliable data foundation empowers marketers to measure advertising incrementality with confidence
Because incrementality isolates causal lift, data consistency is critical. Clean conversion tracking, standardized definitions and centralized reporting reduce bias and improve confidence in test results.
In practice, few organizations have a fully unified measurement framework that connects incrementality with attribution and MMM. When these methods are combined on top of a consistent data foundation, they provide a far more complete picture of marketing effectiveness.
If you’re evaluating incrementality as part of your measurement strategy, make sure your data foundation is strong enough to support it.
FAQs
How long should an incrementality test run?
The duration of an incrementality test depends on factors like sales cycle length, traffic, conversion volume and campaign type (short-term vs. long-term). Short-term campaigns often run for two to four weeks, while longer initiatives may run for multiple months.
These tests must be long enough to reach statistical reliability and account for normal fluctuations. Ending tests too early may lead to misleading conclusions, where temporary spikes or dips are misinterpreted as real lift.
What channels benefit most from incrementality testing?
Incrementality testing works especially well for channels where attribution is often weak or inflated, such as:
- Paid social
- Display
- Video
- Retargeting
- Upper-funnel brand campaigns
When platform metrics overstate performance, or when channels influence each other heavily, incrementality can help separate true lift from existing demand.
Can small teams run incrementality tests without advanced analytics?
Yes, incrementality tests do not require a large data science team to get started. Test design matters more than tools.
Small teams can run effective tests with these basic requirements:
- Ability to define control vs. test groups
- Consistent tracking of outcomes and KPIs
Many ad platforms also offer built-in geo tests, conversion lift tests and audience split experiments, making tests more accessible.
While advanced analytics are not necessary to run a valid incrementality test, teams with strong data foundations are able to move faster, test more confidently and scale faster.