.png?width=460&height=280&name=Untitled%20design%20(12).png)
Since the beginning of marketing, businesses have attempted to understand the influence their marketing activities have on their bottom-line. Today, Multi-Touch Attribution (MTA) models assess the role each marketing touchpoint plays in creating customers and generating revenue. Despite numerous technological advances in tracking and modeling, many challenges still prevent organizations from adopting MTA. Those include:
- Inaccessible, disorganized, and siloed data
- Complex customer journeys
- Marketers’ lack of confidence in their ability to interpret customer data
In this article, I’ll build on our experience with marketing technology clients at McGaw.io to explore MTA, explain how customer data can be cleansed and connected, list out common attribution mistakes, and lead into how you can create and interpret attribution reports. We’ll show the whole process based on the combination of Looker and Funnel, two of my favorite tools.
How Funnel and Looker combine into an amazing attribution reporting solution
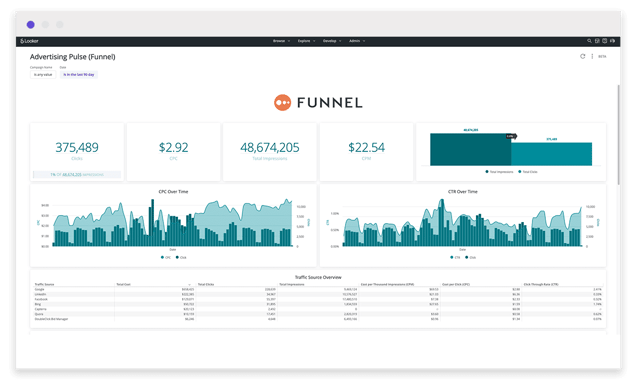
Looker is a business intelligence tool that helps users visualize and analyze their data.
With the right integration and setup, Looker enables users to use numerous multi-touch attribution (MTA) models and produce actionable attribution reports. Luckily, Funnel has such an integration with Looker.
Funnel is a solution that helps organize, clean up, and model your data so that it’s ready to use in whichever tool you need it (and there’s no coding required).
By pouring in your data from Funnel into Looker, with the help of their in-tool LookML generator and data warehouse exports, you can create amazing attribution reports.
Funnel also has a free Looker block for marketing analytics that the Funnel team built, which you can use to quickly get started with your reporting.
Collecting & cleansing your Data
“The problem marketers face [in regards to attribution] is not the lack of data, but how messy their data is. So it’s crucial to make sure your data is cleaned, mapped and organised as soon as it’s collected.” - Tommy Albrecht, Performance Marketing Manager @ Funnel
Collecting and cleaning data, as well as creating reports is easy, as Funnel features hundreds of integrations from leading platforms, including CRM, CMS, digital advertising, and more. And if the data source you’re looking for is missing, you can either import data manually or request that it be added to the Funnel platform. Getting your data connected from one of the hundreds of integrations is just a matter of clicks, and the data immediately starts to load.
Funnel brings in all of your raw data so you don’t lose any granularity, as well as provides you with several out-of the-box dimensions and metrics that are common to marketing (like cost, clicks, impressions, and source, medium, campaign - to name a few) to help make it business-ready. They pull in historical data from your platforms up to two years back (*some sources vary).
Funnel can even pull data from very non-traditional sources, e.g., importing offline data, back-end data, etc. And thanks to the numerous integrations and customization features, you have the potential to bring in data that allows you to attribute your organization’s full customer journey.
A powerful aspect of Funnel, especially for marketers, is that it allows you to clean your data and create customized dimensions and metrics without needing to know how to code.
Once you have all of your data in Funnel, and the dimensions and metrics you need have been created, you can then export everything to Looker. You do so via a data warehouse, then loading the data into Looker (you can learn more about the connection here).
Before Looker can receive this information, you’ll need to integrate the two. Go to the GitHub page of Looker’s Digital Marketing Analytics by Funnel code block, click "See the Code," and download all three files with the .lookml extension—labeled model, dashboard, and “view.” Copy the code, paste it to the “File Browser” tab in the Looker dashboard, click “View Dashboard,” and your report should be ready in seconds.
We’ve built multi-touch tracking and reporting for countless clients, and the combination of Funnel and Looker is one of the most capable solutions out there.
What makes a well-rounded marketing attribution report
A well-rounded attribution report should answer the most pressing questions you have about the performance of various marketing channels. And while your questions will vary depending on your goals, any attribution report worth its salt will include the following data points:
- The channels that generated the highest conversion rate and volume of conversions
- Your most impactful and successful campaigns
- Most common conversion paths taken by prospects
- Average # of touchpoints a customer has before a conversion
- Content formats and and individual pieces that generate the most conversions
- Pages most frequently visited before conversion
With an attribution report that includes each of these elements, you can start to dive deeper and gain more of an understanding about your conversion paths.
Assisted conversions
Prospects take plenty of time to educate themselves before making a big decision, making tracking key touchpoints difficult. The average prospect passes through 56 touchpoints before converting according to an analysis from NextRoll.
These complex conversion paths begs two essential questions:
-
-
- How many touchpoints does it take, on average, to convert your prospects?
- Which touchpoints provide the most substantial assist?
-
Assists apply credit to each touchpoint that leads to a conversion. By totaling the number of assisted conversions across touchpoints, you can gather the average number of interactions it takes to convert customers.
Assisted conversions help marketers get at the long tail of influence your marketing efforts have built, which you can figure out by assessing the number of times touchpoints appear in conversion paths (Discounting the last touch). The more often you see a given touchpoint, the more credit you can attribute.
More broadly, you can think of assisted conversions as a measure of the quality of interactions your prospects have with your touchpoints. Comparing the number of assisted conversions paints a clear picture of which channels could be utilized further and which prospects tend to bail on.
Common conversion paths
Demonstrate the most common conversion paths taken by your users. This helps inform you of the user's context—where they are, what they're doing, and on which device they access your messaging. It can additionally help further pin down the nature of assisted conversions taking place.
What’s more, you’ll want your reports to track your most valuable marketing KPIs and consistently use them across all reports to standardize your approach and make well-informed optimization decisions.
Say you discover the most common path to conversion occurs after two visits from paid search ads. You might increase your paid search budget or initiate a retargeting campaign to pull back first-time visitors.
Multi-touch Attribution Modeling is an iterative process that you’ll refine over time.
Common mistakes in multi-touch attribution reporting
Mistakes are only natural, given that fewer than 10 percent of polled US marketers described their organization’s attribution knowledge as excellent. While natural, they are preventable. Watch out for these common errors in your reporting operations.
Inconsistent tagging and cataloging
Consistency is vital in keeping attribution data clean and, therefore, actionable. To keep your data tidy, you’ll need to keep your marketing taxonomy consistent across campaigns, channels, and sources.
Urchin Tracking Module (UTM), is code designed to be appended at the end of links to can help marketers track these three variables across paid and organic channels:
- Source: The name of the site or platform from which the conversion took place, like Google or LinkedIn.
- Medium: Indicates the general category of your marketing touchpoint, like organic social, paid search, or webinar.
- Campaign: The name or label of the marketing goal that you’re promoting across your channels and touchpoints
Organizational efforts towards building a multi-touch attribution model should be centralized to avoid such inconsistencies. What’s more, UTM link generators can help reduce human error and automate much of the process.
Reporting without a cause
Many who start attribution modeling don’t always have a clear goal in mind; a poor way to start any new endeavor.
This is especially true in attribution modeling, as different models excel at surfacing different kinds of insights. Each model also features blindspots that make them particularly ineffective for some purposes (we’ll delve deeper into the utility of various models later on).
Excluding marketing channels
Multi-touch attribution should aim to include data from all relevant marketing and sales data sources.
Siloed data
Your marketing data is spread thin between numerous tools, platforms, and channels—one experiment found an average of 23.8 tools in each tech stack.
Data connectors paired with business intelligence platforms can help reorder this data. Funnel and Looker, in particular, play very well together in this respect (more on that later).
Comparing attribution reports for our 6 multi-touch attribution models
Now that we’ve laid the foundation, it’s time to get to the juiciest part: learning how six distinct attribution models interpret the same customer data.
We’re using sample reports from the Funnel team’s attribution efforts to help illustrate the utility of the six multi-touch attribution models, one by one. These six were carefully selected by the Funnel’s Performance team—Tommy and Oscar—to provide insights for a wide range of campaign types and analytical goals.
“You'll realize (even if you use the greatest customized model created by your most magnificent consultant at a equally magnificent cost to you) that success then will come not from that rough output, but rather from your ability to take that rough output, make changes, observe the impact (over weeks, or months if you are small sized), identify insights and be less wrong over time.” Avinash Kaushik
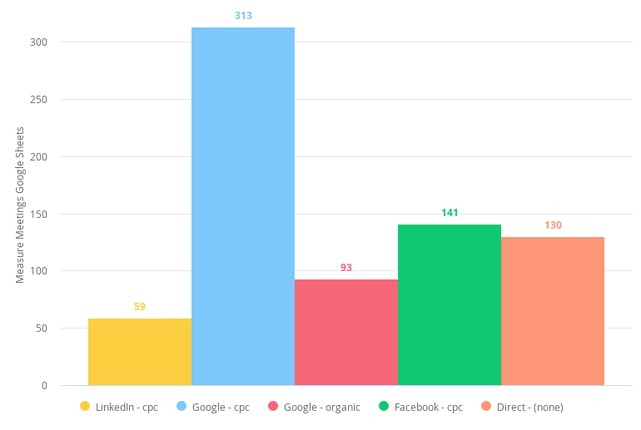
These models have been applied to a real-life PPC campaign run by the Funnel team as part of their marketing operations. The collected data shows the number of sales meetings created by conversions from Funnel's "book a demo" CTA.
The six models are:
- First click
- Last click
- Time decay
- Linear
- U shape
- W shape
For an in-depth dive into those and other models, check out my zero-to-hero blog post about a full variety of marketing attribution models, tools, and dilemmas.
First-Click Attribution
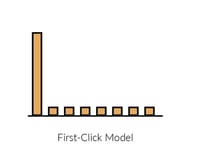
How it attributes credit: 100% to the initial touchpoint.
Funnel example data
The first-click model lays the overwhelming majority of the credit on paid Google search, garnering 43 percent of the credit, and acting as the primary booking provider.
Last-Click Attribution
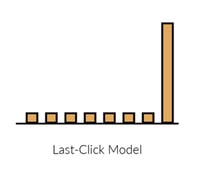
How it attributes credit: 100% to the final touchpoint prior to purchase.
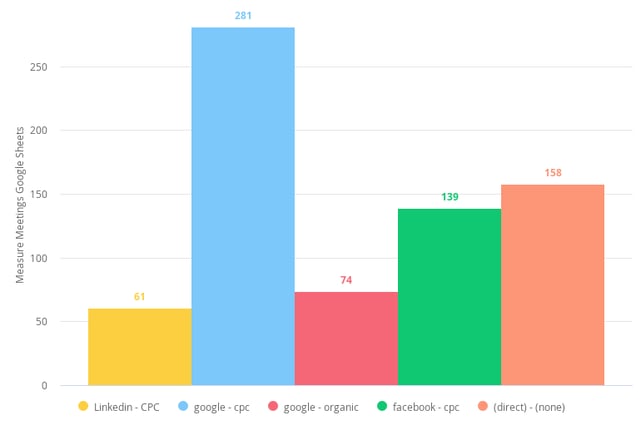
Funnel example data
Here, last click-offers a near mirror image of first-click, still giving primary credit to paid search, albeit less so, at 37 percent, and growing Facebook ads and direct traffic. Seeing Google PPC so high in last-click, on top of first-click, is a welcome surprise. Not only is it our leading provider of bookings, we see that it’s an incredible driver at the other end of the funnel, discovery. Two models in, and we’ve already identified a channel worth doubling down on.
Time Decay Attribution
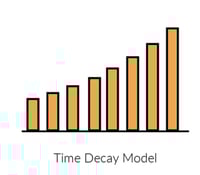
How it attributes credit: Given to all touchpoints, with increasing credit each step closer to purchase.
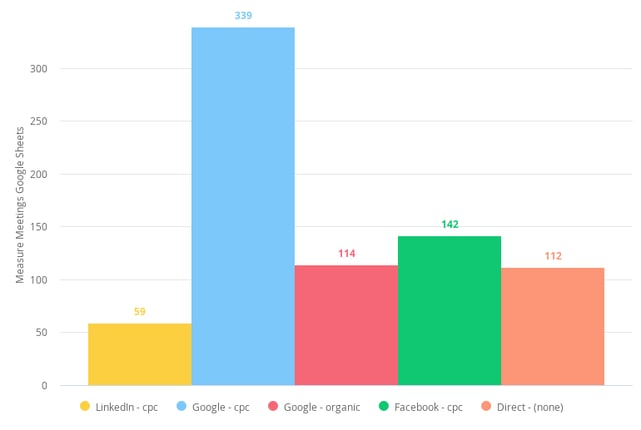
Funnel example data
Time decay attribution greatly extends paid search’s attribution credit. This indicates that the channel is highly effective in converting leads into meetings, validating the channel as a whole, and demonstrating an opportunity for more significant investment.
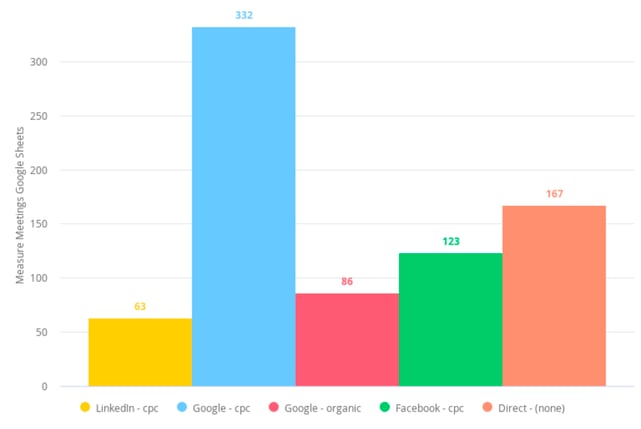
Linear Attribution
How it attributes credit: Evenly among all touchpoints.
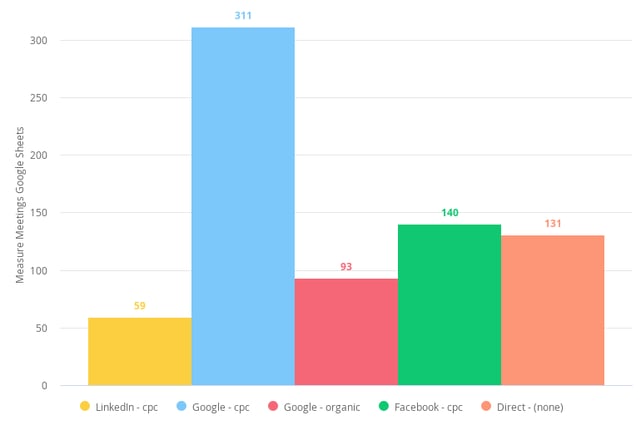
Funnel example data
Linear attribution is unique in that it ensures all touchpoints receive some credit and helps surface the assistive relationship between touchpoints.
Linear multi-touch attribution doesn’t emphasize any tactic over another but instead focuses on each touchpoint throughout the customer journey equally. The model, however, provides no insight into how effective each channel drives a conversion.
One may assume that an even distribution of credit would flatten our graph, but that would require all 766 registered conversions to have the same five-point customer journey. This model instead further validates paid search as the best-performing channel, reaching around 41 percent, and appears to have a substantial assistive capacity as well.
U-Shape Attribution
How it attributes credit: 40% first touch + 40% last touch + 20% spread evenly between all other touchpoints.
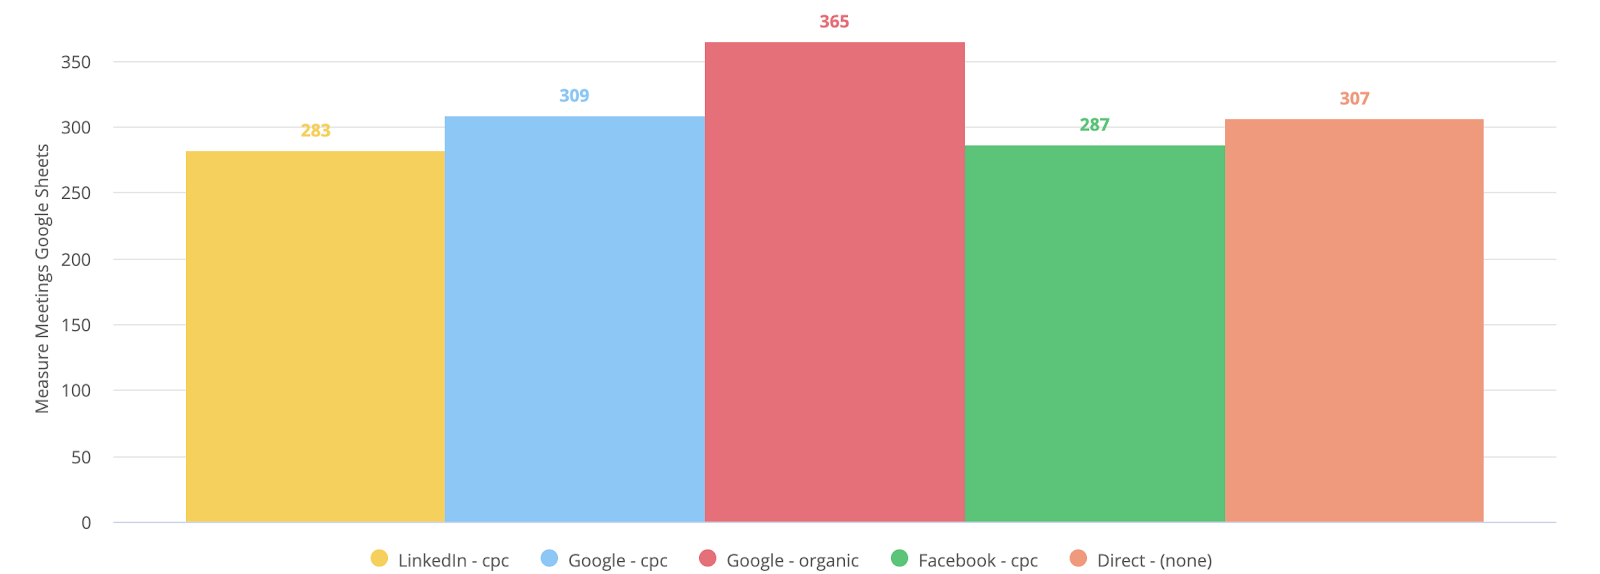
Funnel example data
Also known as position-based attribution, this model initially gained traction on Google Ads and other search advertising platforms.
U-Shape attribution emphasizes the importance of the first and last touch and considers the weight of those in-between. Its main strengths lie in surfacing the channels that draw substantial traffic and convert a high rate of prospects.
Here, U-Shape attribution paints an entirely different picture. Most of the credit —48 percent—still goes to organic search, but the rest of the touchpoints receive a much more distribution. Our channels even out in performance under the U-shape model, which validates that LinkedIn CPC, Google Organic, and Facebook CPC contribute to the top and middle stages of our funnel.
“Every attribution model has built into it biases and opinions that often struggle to stand any intellectual scrutiny, or the simple laws of common sense.” - Avinash Kaushik
W-Shape Attribution
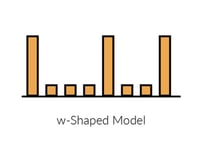
How it attributes credit: 90% split evenly between the touchpoint that provided the initial visit, lead conversion, and deal creation—10% evenly split among the rest.
Funnel example data
The W-Shaped attribution model is distinctive in that it splits the vast majority of credit, 90 percent, to three significant steps leads take through conversion: initial visit, lead conversion, and deal creation. The remaining ten percent is distributed equally to each interaction in-between.
Paid search is dominant in W-shaped attribution as well, giving it approximately 40 percent of the credit for all generated meetings.
Insights gained from our case study
Prior models have revealed that Facebook CPC seems to perform better than LinkedIn CPC in generating bookings and discovery. If the budgets for the two channels were the same, we’d want to closely examine the LinkedIn campaigns and either pull budget from them or make significant improvements. If the smaller number of bookings generated from LinkedIn CPC is proportionate to a smaller ad spend on the platform, our LinkedIn CPC effort may be ready to scale.
“The main takeaway here is that no model is intrinsically better than the others. It’s the marketers job to test and understand what makes more sense for their reality.” - Tommy Albrecht, Performance Marketing Manager @ Funnel
Over to you
Given the blindspots present in even the most well-honed attribution model, the best advice I can give is to test, compare, iterate, and repeat. The faster we all improve, the closer we get to answering one of the longest-standing problems in marketing: understanding the true impact of our marketing efforts.
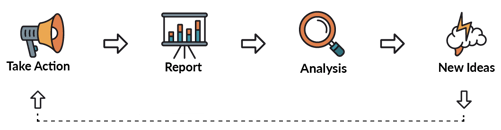
So, what’s next?
- Take action. Here’s a checklist for you to use to get started with attribution
- Set up your own marketing attribution reporting with Funnel and Looker.
- Get help from the experienced MarTech agency team at McGaw.io
- Looker Studio running slow? Read our tips on how to speed it up.
- Reporting for clients? Try these 9 best practices.
- Leave a comment and/or share with peers you care for