We work with thousands of marketers worldwide. Recently we have been observing a new trend. Marketers are increasingly building a sophisticated reporting stack to replace siloed reporting tools and spreadsheets. First we started to see large organizations do this. But now we are seeing companies with annual advertising budgets starting at $1 million building these reporting solutions. There are a number of drivers behind this:
- Marketing is increasingly becoming measurable with 50% of all marketing being digital by 2021 as reported by eMarketer. If you measure correctly you can make much better decisions, acquire more customers, and drive significant growth in your business. But you need to have the right reporting tools in place to do this. Smart marketers have realized this and are taking action.
- General-purpose visualization tools are becoming available to the mass market. This has been a trend over the past couple of years with the big business intelligence companies moving to cloud offerings with per-seat pricing. The end of 2017 saw an acceleration of this trend with Google offering Data Studio (now called Looker Studio) for free which resulted in a large uptake among marketers.
- Data warehouse technology is increasingly becoming available to a mass market. These products were typically sold as expensive software products to big enterprises. Now they are readily available as cloud-based pay-as-you-go solutions from Google and Amazon.
- Automation of data import and mapping has been made much easier with new breeds of companies providing this as a service or offering greatly simplified tools for building data imports.
- Marketers are increasingly focusing on having a good marketing setup which includes things like tagging campaigns and URLs and using a third-party analytics tool as the source of truth for advertising performance. This is a prerequisite for effective reporting.
Marketing is becoming more measurable
A recent report by eMarketer forecasts that online advertising spend will grow from $266 billion in 2018 to $376 billion in 2021. This is a growth of 41% in three years as illustrated in the chart below. Even more important, by 2021, 50% of all advertising will be digital, up from just over one-third in 2016.
This shift from traditional marketing, to digital marketing also means that a lot more marketing will be measurable. No more guessing if your marketing works or not - if you are set up to properly take advantage of this. And with more of marketing taking place online, comes more data, and also more marketing analytics possibilities.
The shortcomings of siloed and manual reporting
When we speak to marketers we find that they have traditionally either used siloed reporting tools for their marketing or reported manually using a spreadsheet. Both of these approaches have shortcomings and we are finding that marketers are increasingly looking to move away from them:
Siloed reporting
Marketing reporting tools have traditionally been built as vertical solutions that import the data and visualize it in one application. The visualization is typically done in siloes where only data from one source can be viewed at a time. There are literally hundreds of reporting tools for creating marketing reports for a number of the most popular data sources. They are easy to use and you can usually get started by yourself.
The shortcoming of these reporting tools is that they treat the data from different platforms separately. For example, you can make an Adwords report and a Facebook report, and a Google Analytics report. But you cannot make a report that takes cost data from Adwords and Facebook and combines it with transaction and revenue data from Google Analytics. Instead, you have to use the conversion tracking of each advertising platforms themselves in your reporting as that is the only data that is available in that silo.
As the conversion tracking of the advertising platforms only signals whether ads from that specific platform were clicked/viewed prior to conversion, relying on the sum of these conversions will likely overreport on the performance of all advertising channels. It does make your marketing look better, but it is not correct. Because of this, most sophisticated advertisers tend to use a separate analytics tool for evaluating the performance of their marketing efforts, which is a more accurate way of accounting for results. This is not possible with siloed reporting tools. Instead, analytical marketers tend to do their reporting manually using a spreadsheet.
Manual reporting
Data-driven marketers typically evaluate their marketing based on results from their analytics platform, CRM or another backend system. To get the maximum flexibility in supporting the model that they have built for their customer acquisition they often export their data to a spreadsheet and do their reporting there. This has a number of drawbacks:
- It is time-consuming, boring, and error-prone to export large amounts of digital marketing data from a number of data sources. When your business grows and you use a large number of advertising sources and have more than ten markets, websites, or brands to track, it may even get to the point where it is not tractable to do the reporting manually.
- Only when you have just done the reporting do you know what is going on. That is usually only once a week. A lot of opportunity for optimization and taking corrective action has been lost by then. By the time you have completed your report, it is almost out of date. Not a great situation.
- There is a limit to how granular the model can be in a spreadsheet. Typically it is hard to see data with daily resolution or to drill into campaign or even ad level data. This limits the ability to quickly see trends developing and the detail of the analysis that can be done. Say for example you want to slice the data by device. Unless you had this data in your report it is just not there for you to analyze.
The marketing reporting stack
We are now finding that marketers are increasingly building a flexible and automated marketing reporting stack based on best-of-breed components. The goal is to have all data available and up to date at all times. This stack typically has three layers, with each layer consisting of one or more products from different companies. This allows you to find the best of breed and flexible components that fit your needs.
The role of the layers are as follows:
Visualization
Tools typically used for data visualization include business intelligence products like Google Data Studio, Looker, Tableau, Microsoft Power BI, and Qlik. General-purpose visualization tools are becoming available to a mass market as they are moving to cloud offerings with per-seat pricing. Google has taken this to the next level by offering Data Studio for free. This has resulted in a large uptake among mid-market marketers. Larger organizations still tend to rely on more advanced business intelligence tools. The chart below shows the current pricing of the different tools. There is a range of capabilities and price points, but the bottom line is that all these tools are affordable for a marketing team.
Data warehouse
A data warehouse is a highly scalable data repository used for reporting and data analysis. The visualization tool is connected to the data warehouse to pull the data needed to feed dashboards and facilitate ad hoc analysis.
The market for data warehouses has traditionally been dominated by companies like Oracle, IBM, and SAP selling large installations to enterprises. However, new cloud-based offerings from Google and Amazon have made data warehouses available to the mass market with self-service offerings and affordable pay-as-you-go pricing. The 2016 Gartner Magic Quadrant for data warehouses below illustrates how fast the market is moving. Google BigQuery is now the most popular data warehouse that we hear marketers using but in 2016 it was not even in the Magic Quadrant graph. As a result of the recent popularity, the 2017 Magic Quadrant graph does have Google in it.
Data import platform
Getting the data into the data warehouse has been the most challenging part of building a reporting system for a marketing stack as there traditionally have been no good tools on the market that completely solve this problem. Most marketing data lives in third-party advertising and marketing platforms. Getting the data into the data warehouse involves integrating with and maintaining a large number of APIs.
There have now emerged different types of solutions to this problem. Sometimes you can find one tool that solves the entire problem for you and sometimes you have to use a combination of tools to get all the data into the data warehouse. Broadly speaking there are two types of tools that have started to emerge:
- “Data as a service” platforms focused on marketing data. These platforms pull in data for all or most of your marketing data. Because they only operate in the marketing domain they understand the data well and typically provide it in a clean and compact way.
- General-purpose ETL (Extract Transform Load) tools. ETL tools have evolved a lot over the past couple of years. They now provide ready integrations to a number of the larger platforms. In addition, they have tools that allow for integrations with new platforms. They are relatively easy to use, but you do have to have some technical knowledge to use them and you are responsible for maintaining the connections to the platform.
It is important to note that not all connections are equal. Just because a tool has a connection to a platform you need, does not mean that you can get exactly the data you need or that the data is accurate. Marketing platforms often change their most recent data and implementations need to take this into account. Also, you need an implementation that understands when you add a new account to a platform and backfills the data warehouse with the historical data.
Finally, getting the data into the data warehouse is not the only problem. When data warehouses and big data first became popular, analysts started talking about the concept of a data lake. The reasoning went something along the line of “Just put all the data you can get hold of in your data warehouse. Then you always have access to all the data you need.” We have now learned that this is not a good idea. If you do this it is very hard to find and use the data that you actually need. Especially if you are not the one who put it there in the first place. What you really want in your data warehouse is a nicely structured, cleaned, and mapped set of data that is easy for everyone to use. The earlier in the process you think about this, the easier it becomes later.
What you can do with a reporting stack
The exact benefits of building a marketing reporting stack depend on the specific use case for your organization. The largest one is probably flexibility. Every business is unique and one of the largest advantages of having an automated reporting stack is that it’s very flexible and allows you to create the types of reports you need. If there is a new data source that you require access to you can just add it to the data warehouse and map it with the other data and you are ready to update your reports to include this new data.
Here are some examples of the types of reporting that can be done with marketing data in a data warehouse and the benefits of them:
Tracking overall marketing spend according to budget
Next time you meet a marketer, ask them (or ask yourself if you have a marketing budget) the following question: As of today, what percent of your marketing budget have you spent so far this month, and is your overall spend tracking above or below budget? More often than not you don’t get a straight answer. Because they do not know. The spend for different marketing channels is typically tracked in different tools or in different siloed reports. Nowhere is it added up every day.
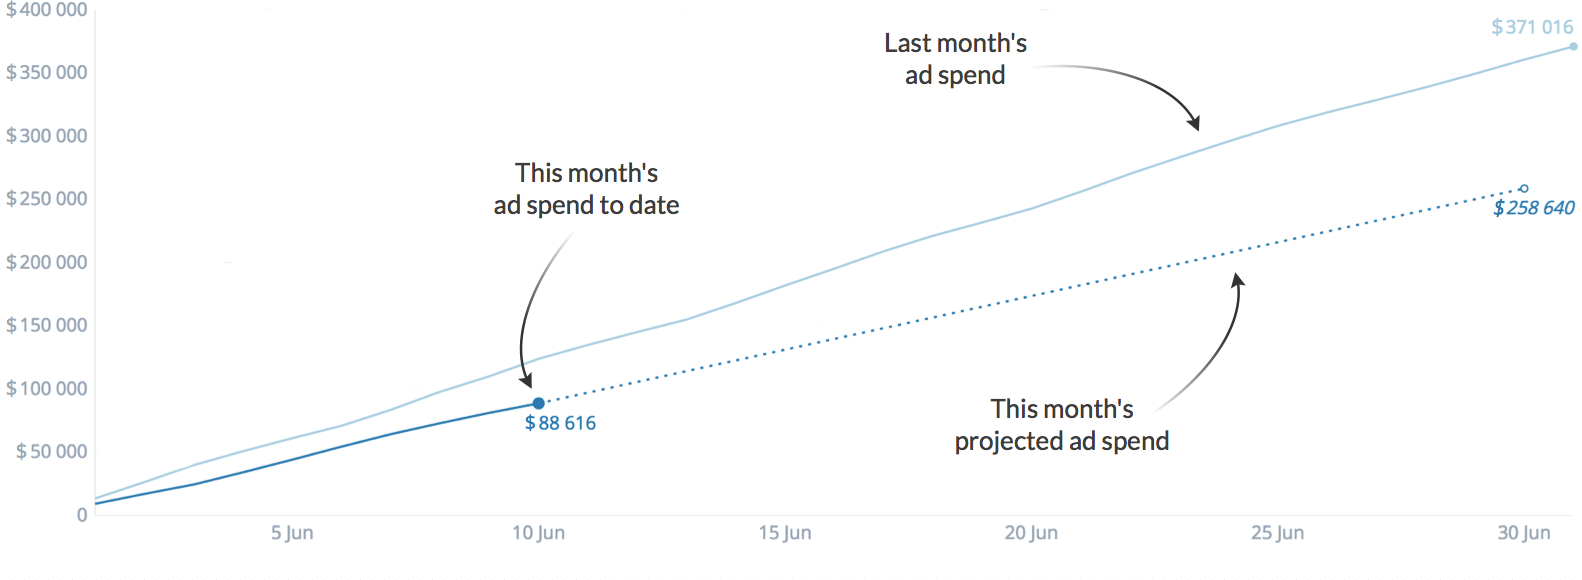
With a marketing stack, you have all the data collected automatically that is needed to visualize your overall marketing spend. The picture below shows an example of a visualization of the overall marketing spend for a business. Note that the data points are created by collecting data from a number of data sources. Say that you use ten different advertising platforms and advertise in six different markets. For four of the advertising platforms, you have one ad account for each market. For the rest of the advertising platforms, you have one ad account for all markets. Then you use a total of 4*6 + 6 = 30 advertising accounts. Each data point for each day is created by summing up the advertising spend from the 30 advertising accounts. This graph shows the cumulative spend for last month’s and this month’s advertising spend. It also forecasts where the spend for this month is going to end up. You can also put a budget line in the graph to see how you are tracking according to budget. This graph is great for staying in control of your advertising spend. Once you have a graph like this you will not understand how you ever managed without one.
Customer acquisition reporting based on mapped data
In siloed reports, the performance of each advertising platform is reported on separately. However, most performance-oriented marketers want to see cost data from the advertising platforms and transaction and revenue data from a third-party analytics solution. With an automated reporting stack where all data is properly mapped together before it is put in the data warehouse, this is possible. The table below shows one example of this.
| Ads channel | Ad spend | Sessions | Transactions | Assists | Revenue | CAC | ROAS |
|---|---|---|---|---|---|---|---|
| AdWords Search | $45 489 | 36 012 | 1 801 | 3 601 | $194 465 | $25 | 428% |
| AdWords Display | $9 765 | 28 319 | 283 | 850 | $28 035 | $34 | 287% |
| Bing | $8 345 | 6 828 | 273 | 546 | $28 130 | $31 | 337% |
| $37 654 | 115 472 | 2 309 | 8 083 | $228 635 | $16 | 607% | |
| $4 921 | 5 249 | 142 | 638 | $14 172 | $35 | 288% | |
| $3 548 | 1 833 | 55 | 220 | $7 149 | $65 | 202% | |
| YouTube | $12 493 | 7 853 | 275 | 825 | $26 660 | $45 | 213% |
| Total | $122 215 | 201 566 | 5 138 | 14 762 | $527 248 | $24 | 431% |
Table with mapped customer acquisition data
Typically this is data for a week or a month or some other time period you decide on. Here we have data from six different advertising platforms (with the AdWords data split into two parts) and transaction and revenue data for each advertising platform from an analytics tool.
Based on this, new columns, such as customer acquisition cost (CAC) and return on advertising spend (ROAS), have been calculated. CAC is calculated by taking the ad spend from each platform and dividing it by the number of transactions from that platform as reported by the analytics solution. ROAS is calculated by taking the revenue for each advertising platform as reported by the analytics solution and dividing it by the ad spend for that platform.
Now you know exactly how each advertising platform is performing in an objective manner. If you want to you can look at the data based on marketing strategy such as display, search, retargeting, email, SEO instead. Or you can take a look at how each product category or vertical is performing.
Rollup of markets, websites, brands or customers
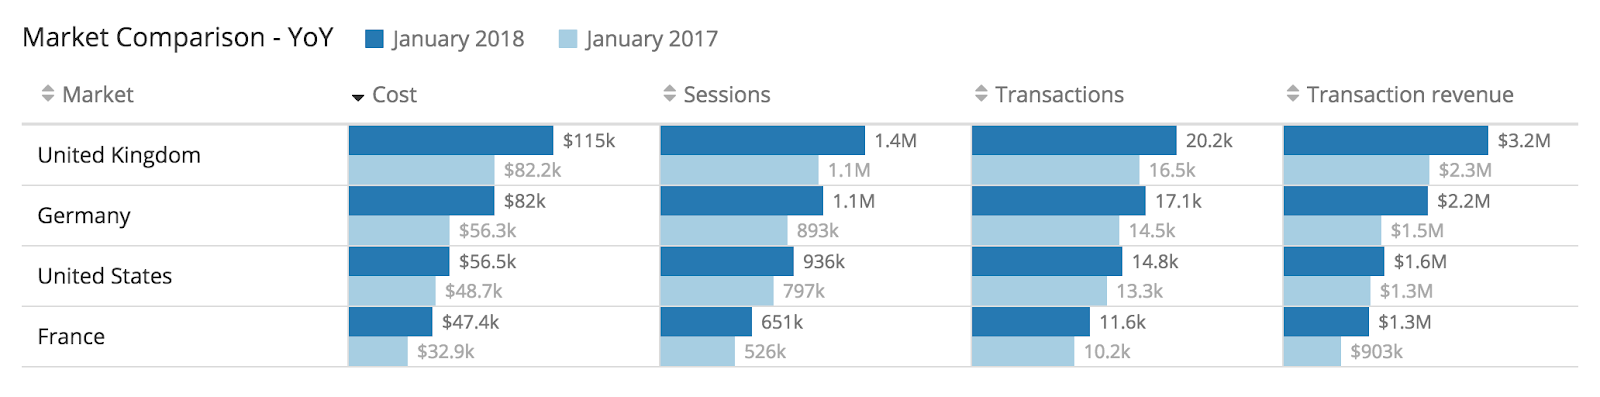
Most analysis is often done for a specific advertising channel or website. But it is sometimes useful to get the complete picture of your advertising rolled up across all advertising platforms and all markets, websites, brands, customers, or whatever other entity matters for your business. As long as the data has been properly tagged and mapped, all this data is available in the data warehouse. For example, the table below shows a monthly year-on-year comparison of different markets for an eCommerce business.
Great organizations use accurate marketing reporting to drive growth
Many companies are unsure about the exact effect of their marketing. As a result, they view it more as a cost center than a revenue center and tend to underinvest in their marketing. This restricts their growth and makes them vulnerable to more aggressive and data-driven competitors. This is especially true now that more and more marketing is becoming measurable. Not having a good system for this when others do puts your organization in a weak position.
You might find this interesting as well: What is the Modern Data Stack?
Leading data-driven companies build detailed marketing reporting models that show the exact impact of marketing on revenue and as a result, can invest a lot more aggressively and confidently in their growth. If a modern, data-driven company enters your market segment, is your marketing reporting ready to take them on?
By building a marketing stack you will be able to:
- Always have control over how you spend your overall marketing budget
- Build dashboards that track the KPIs that matter for your business and are based on the true performance of your marketing as measured by third-party tools
- Do sophisticated analysis of your marketing based on granular and up to date data
- Invest with confidence in your marketing as you can track and report on the true impact it is having on the growth of your organization