
Funnel, at its foundation, is a data aggregation service. As such, it should come as little surprise that a common topic for discussions we have internally as well as with customers is that of metrics. Some of these discussions are simple and straightforward. A customer needs metric X from advertising platform A so we’ll make sure our connector includes that metric when downloading data.
However, Funnel downloads and stores data from a wide range of data sources for customers, which complicates matters slightly. Since Funnel stores the data, it also aggregates metric values across time ranges or other breakdowns (like campaigns) when requested by users. This works much like how a spreadsheet containing data broken down by day would.
The way this data behaves when aggregated is often overlooked so I thought I’d share a few basic pointers to help you avoid falling into the most common data aggregation traps. I’m going to run through two examples where data aggregation becomes problematic. The first one probably is familiar if you’ve worked with some kind of statistics. Reading this will help you understand aggregated data, and how data aggregation mistakes can be avoided.
Data aggregation 101
Say I’ve got a daily breakdown of cost per click (CPC) for the first seven days of January:
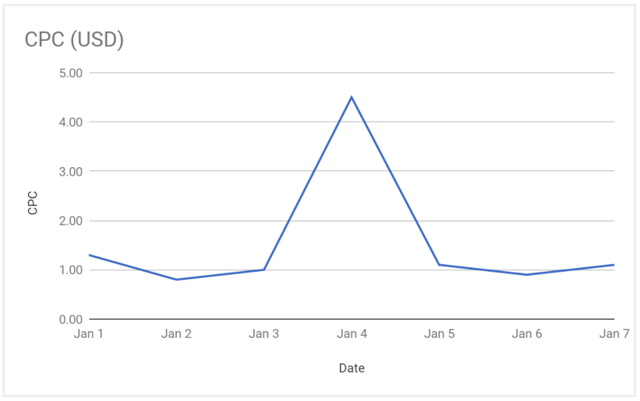
I’m interested in finding out what the Average CPC was for the whole period. Throughout this article, I’ll refer to the most simple (and obvious?) approach to data aggregation as the “naïve method”. In this case, the naïve method of aggregating the CPC value for each day and dividing it by number of days will most likely not give me the actual CPC for the period. Here’s what the calculation would give me:
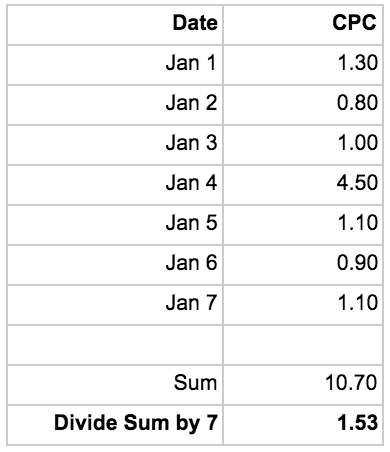
This method does not take the relative weight of certain days into account. I saw a CPC spike on the 4th, which will cause my “total January CPC” to appear larger than it actually was. If I, instead, calculate the average CPC for the period by looking at the total cost and divide it by the total clicks I get the actual CPC:
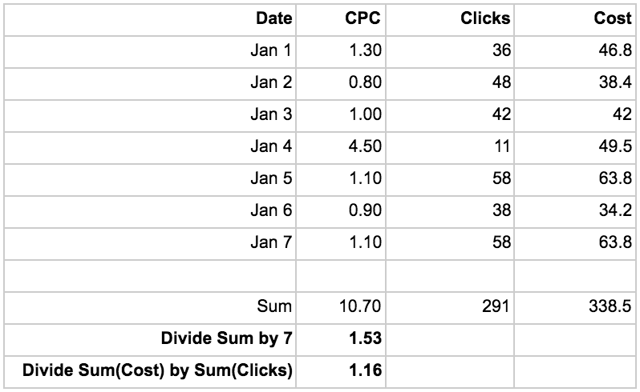
I got a relatively low amount of clicks on the 4th but saw the same cost which had a substantial impact on the CPC for the day, but from an aggregated perspective it didn’t really make that much of a difference. The naïve approach ended up exaggerating my actual CPC with 32%. That’s no small error!
This example might have been kicking in an open door as I’m sure a lot of people reading this are fully aware that aggregating ratios like this doesn’t produce the correct results. So, let’s move on to a more complex example of where data aggregation becomes a bit messy.
Metrics unique to their segmentation
Some metrics don’t lend themselves to data aggregation, not because they are ratios calculated from other metrics, but because of what they represent. Let’s look at a measurement of people that have been exposed to my online ads (“Reach”):
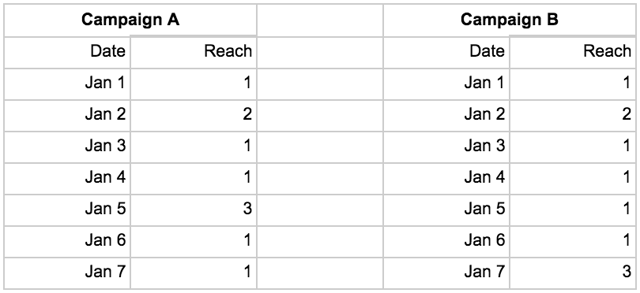
I want to know how many people were reached by campaign A and B, respectively, as well as how many people I reached in total. With the data at hand in the tables above that is impossible to say. The naïve solution here would be to aggregate the values for the respective campaigns, which would give me this:
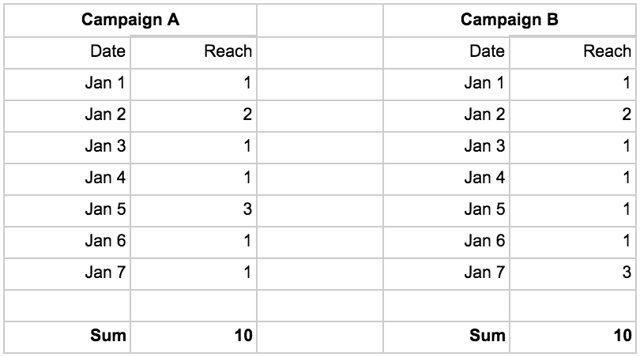
A reach of 10 per campaign, and 20 in total. However, what if the actual people I reached were these:
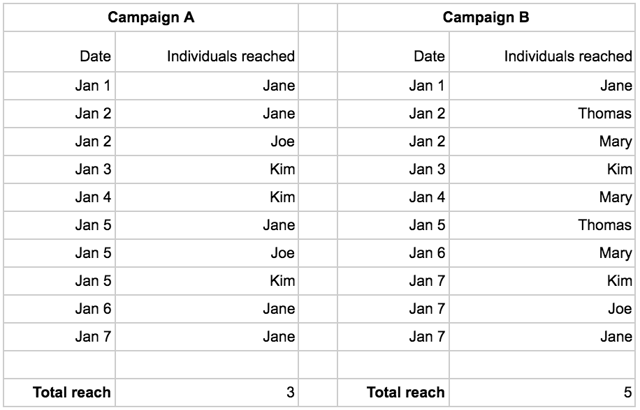
It turns out my total reach for campaign A is 3 (Jane+Joe+Kim) and 5 for Campaign B (Jane+Thomas+Mary+Kim+Joe). My calculation overestimated reach for my campaigns by about a factor 3 and 2, respectively.
The same logic holds true if I’m aggregating across campaigns as opposed to across dates. If I’m interested in the total reach across my two campaigns for January 7th the naïve calculation would be 1+3 = 4, which would be wrong. “Jane” was reached by both campaigns and should thus only be counted once, which means my total reach for that day is 3.
Complex aggregated data
When aggregating across both the date and the campaign dimension to get the total reach, things spiral out of control completely. The actual reach for both campaigns over the time period is 5 (Jane+Joe+Thomas+Mary+Kim). My original calculation gave me 20, an overestimation by a factor 4!
There are plenty of metrics like this one; metrics that by their nature do not allow aggregation. Any analysis from an aggregation like this will likely be wrong. If I’m lucky and the error is small, it probably doesn’t affect my resulting decisions too much.
Worst case, however, the error is large and I end up making decisions that severely impacts the effectiveness of my marketing which in turn ends up costing me a lot of money to no good at all.
How do I avoid data aggregation mistakes?
The only way to accurately perform data aggregation across any segmentation of a metric like this is to have access to the most granular breakdown possible. This is rarely the case, at least not when it comes to advertising data. For our reach metric above, this would mean having access to data about each individual ad impression and to whom it was served. Very few advertising platforms allow access to this data.
Also read: What is data driven marketing
However, this does not mean metrics like these are useless. They are great for measuring what they’re designed to measure, but it’s paramount to be aware of their limitations when performing analysis. As long as I’m only letting the provider of the data do the data aggregations (only letting Facebook aggregate reach and AdWords aggregate average position, for example) it's all good. But as soon as I export the data and start doing my own calculations, I must be aware that any data aggregation of a metric like this will likely produce erroneous results.
Thanks for reading! For more on data aggregation, see the video Alex made about it here.