You can look at a marketing funnel in many ways, but the principle remains the same for your marketing strategy and how you structure your campaigns.
You want to:
- Introduce a problem or an issue your business helps solve at the top of the funnel (also known as the awareness stage)
- Persuade potential customers, your target audience, to buy your product or service as quickly as possible (also known as the consideration stage)
- Get repeat customers and gain their loyalty
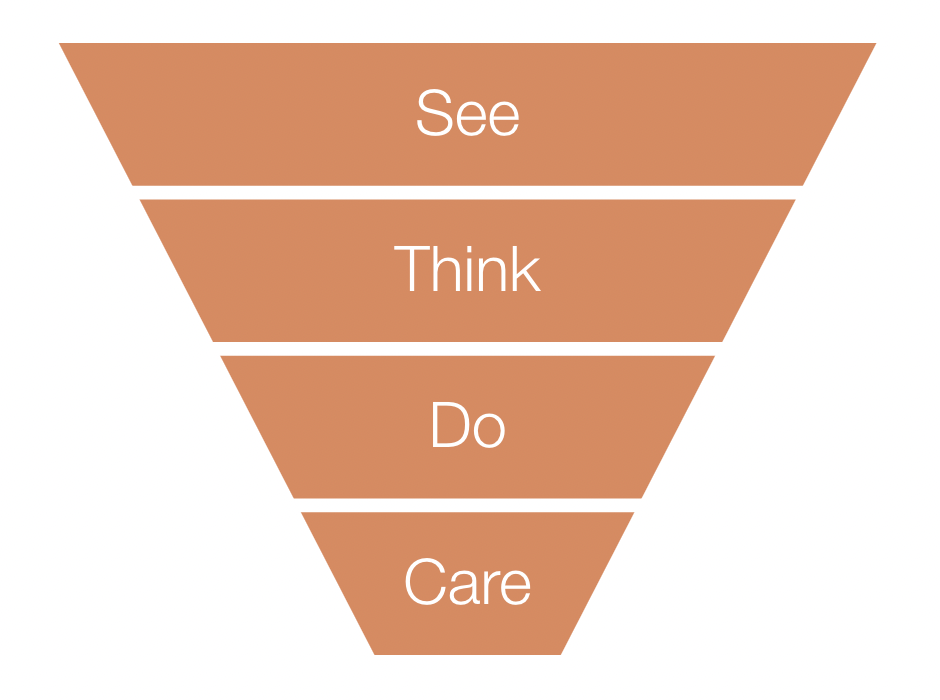
The well-known "See, Think, Do, Care" model is a common way to look at the customer journey. It’s a typical KPI framework advocated by Google and forms part of an effective marketing strategy.
Also, many companies use this framework for their content marketing or sales funnel approach and create content with these stages in mind, for blog posts, marketing and sales collaterals, social media, etc. The aim is to attract new customers with a customer-centric framework and this model helps achieve that.
How to use Funnel to map data to the marketing funnel
At Funnel, a fundamental principle of our data transformation is the ability to map your marketing data together so that you can visualize it consistently and understandably.
You can do this through a series of rules that essentially tell Funnel how to organize your data based on how you've structured it in each platform.
Still, that means how you:
- Intend to structure your marketing campaigns will affect your data strategy
- Collect advertising data will also affect how you visualize it
Because of Funnel's flexibility, you can set up your account based on your campaign structure and apply a series of rules reflecting how you think about your business.
As you can imagine, with thousands of clients, Funnel works with each account in various ways. Our success team is dedicated to building bespoke solutions that complement our customers' campaign structure and help them to map their data to their marketing funnel.
Now, let's walk you through creating a clean Funnel setup based on this famous marketing funnel.
The See, Think, Do, Care marketing model at Riks TV
My good friend and former teammate on the football field, Per Forgaard, happens to be a happy Funnel customer.
When I reached out to learn how he implemented Funnel at Riks TV in Norway, I couldn't wait to share a how-to article. The way he uses Funnel to map his campaign data to the model is clean, clear, and informative.
Over at RIKS TV, they view the customer acquisition journey through the "See, Think, Do, Care" framework. All campaigns, across each platform, target one section of the marketing funnel. In Per's words, "All activity has a purpose, and we label it as such."
Per explained further: "Before Funnel, we had a good campaign structure but weren't able to include 'spend' data from each source. So, we had general performance numbers, but we weren't able to see how it was delivered or how it was tracking to our budget...and the dashboard was super slow!"
For him, the challenge was finding a way to report on his digital marketing activity through the lens of "See, Think, Do, Care."
Fortunately, Per had already updated his campaign structure with clear and consistent naming conventions. It sounds like a small detail, but as our VP of Marketing, Juuso Lyytikkä, emphasizes, "The process of naming conventions varies from marketer to marketer, but it is still vital to have one."
Having taken the first step, Per wanted to visualize graphs and tables in Google Data Studio, with each page reporting on a specific funnel stage.
We helped Per map his data from each platform before sending it to Google Data Studio for quick analysis.
You can think of mapping in this case as:
It tells Funnel how to organize the data from various platforms before pushing the data to the desired destination.
Per set out to make a series of custom dimensions (rules) to give Funnel the information needed to organize the data.
As you can see in the example below, we first created a custom dimension called "STDC Channels." Essentially, this dimension told the platform to group the channel-specific activity based on the presence of the funnel stage in the campaign name.
Per could now view the performance of funnel stage by platform, grouping campaigns together in each tool.
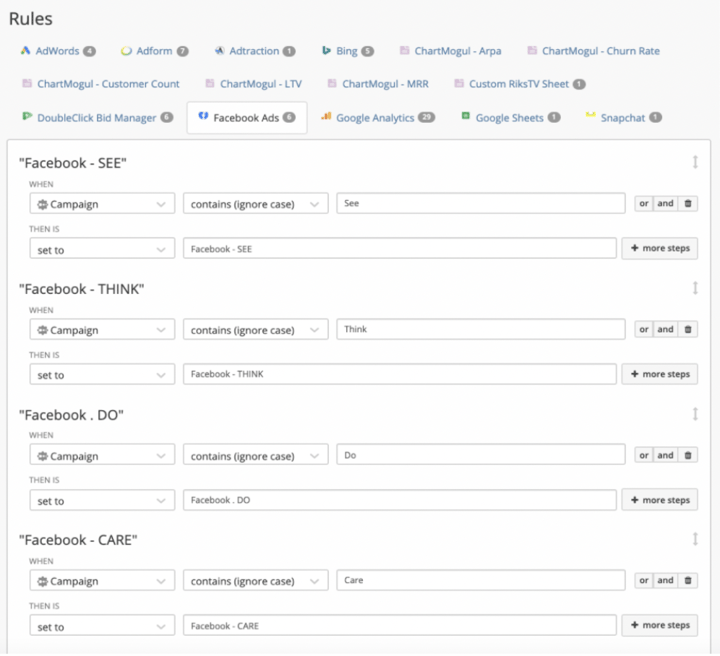
*Note that "contains (ignore case)" is the broadest rule application, and depending on your naming conventions, you may wish to be more specific and use our "split by" or even "regex" functions to ensure nothing slips through the net.
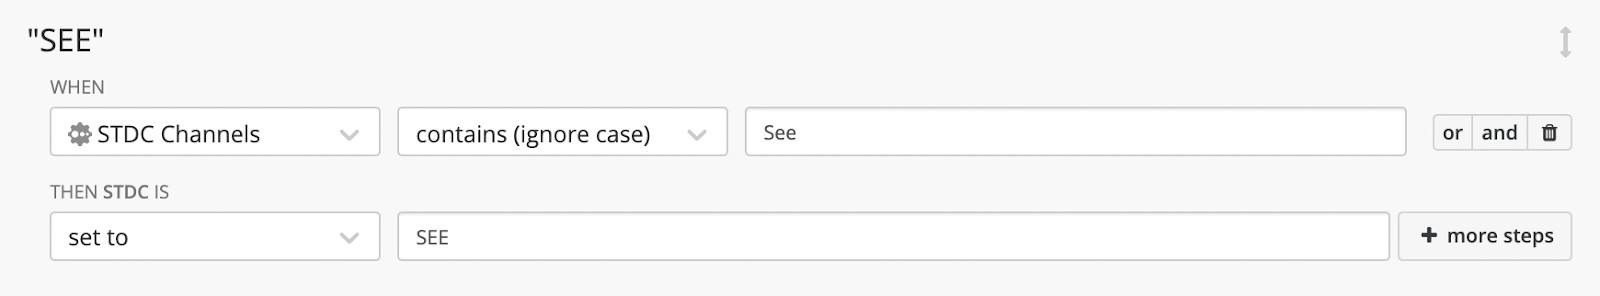
Next, we needed to create a custom dimension that groups activity from all platforms under each funnel stage. We built this slightly differently and got our platform to:
- Look at the previous dimension
- Identify every campaign labeled with a funnel stage
- Group them again
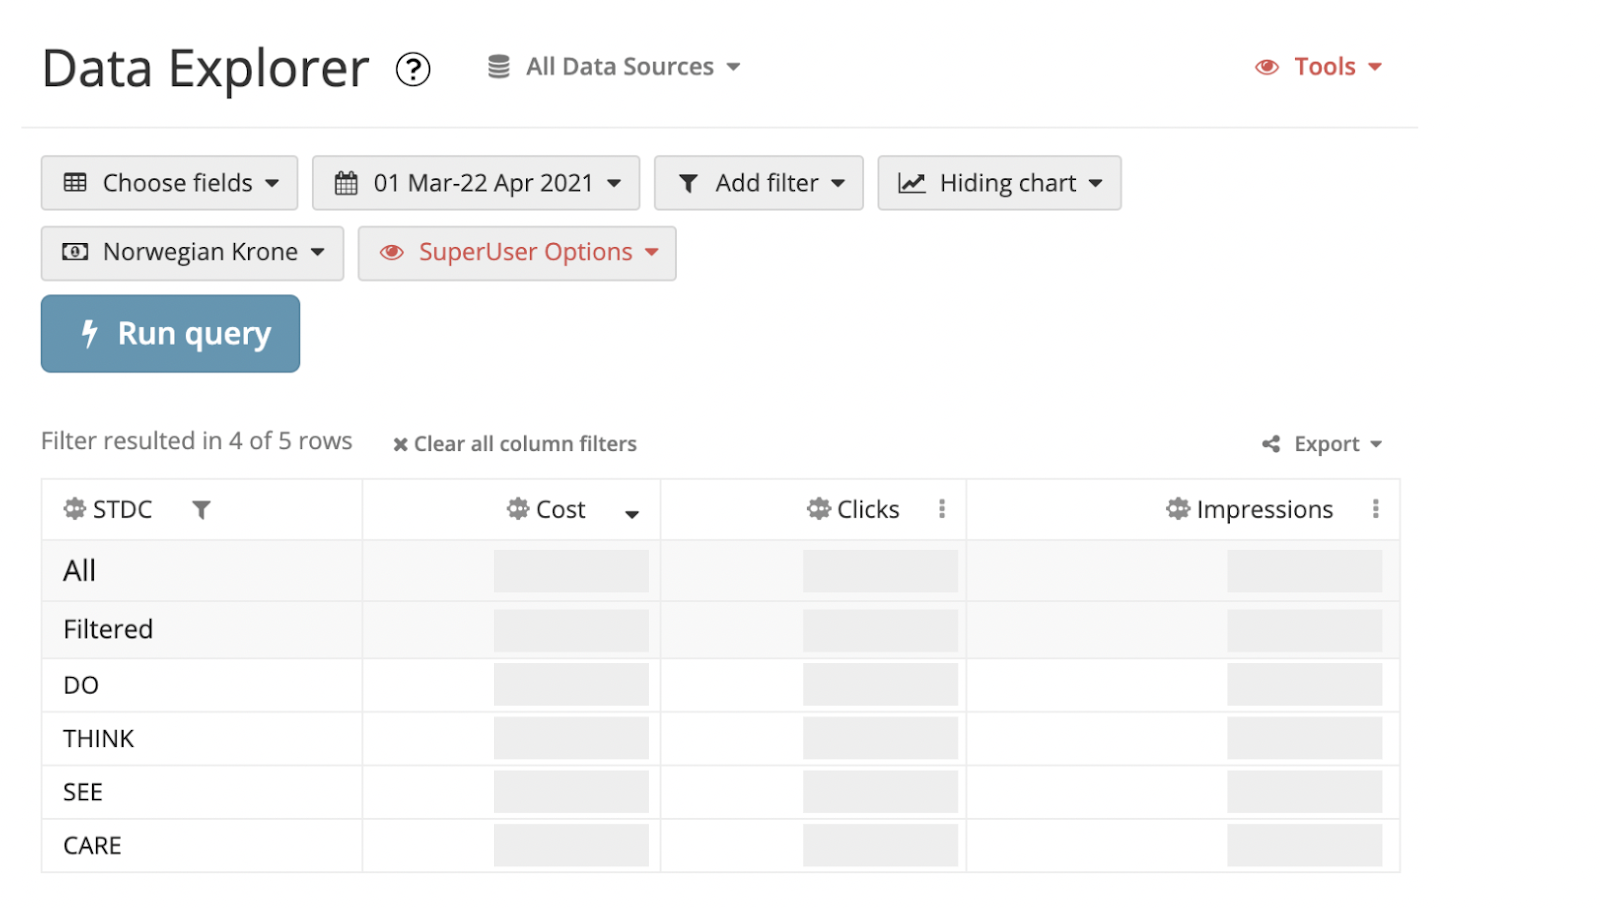
The steps above allowed Per to see metrics like cost, clicks, impressions, and more for each customer journey stage.
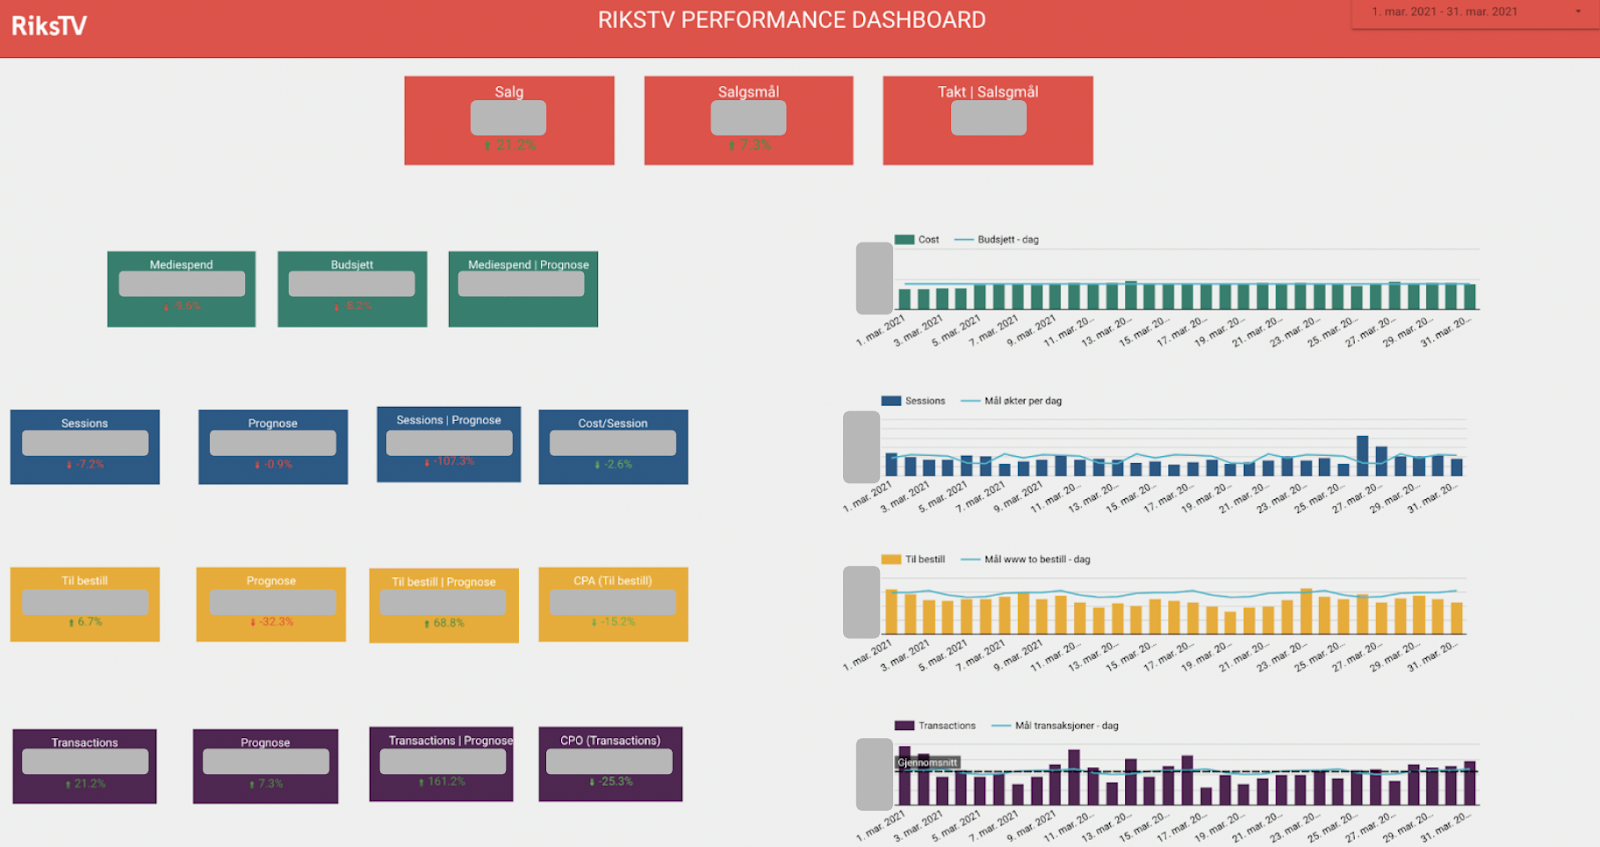
As a result, data is organized, as seen in the screenshot from our Data Explorer (which has been grayed out intentionally here for confidentiality). Per then pushes this data into Google Data Studio, where he builds amazing dashboards.
Per also used his previous agency experience to create a budget forecast. He did this by uploading a Google sheet to display a daily budget alongside each funnel stage. There are a few ways you can do this in Funnel, and fortunately, our fantastic data engineers have written a how-to article on the topic.
"I look at the dashboards every day for both brands (Riks TV and Strim), and they make my job so much easier."
Besides using his Funnel-built reports for daily optimizations, Per also uses them to update stakeholders about the company’s digital acquisition.
"For me, simple visualizations and dashboards are a great tool to get a snapshot of how we are performing on key metrics. Today there are so many data sources and KPIs to keep track of. To get it all in one place, clearly connected to business and brand goals, simplifies data and helps us stay focused."
Ole André Skarbøvik - Commercial Director at Riks TV & Strim.
However you choose to structure your campaigns, here’s the thing...you can use Funnel to map your data together, and that’ll make building automated reports easier and quicker.
Just like Per at Riks TV, you can do the same.