






It’s Monday morning, and the team opens the weekly marketing dashboard to check campaign performance. Someone notices paid conversions look lower than last week. Another person checks Google Ads and sees that they’re up. Someone else pulls data from Meta, and revenue attribution doesn’t match.
A few minutes later, the conversation shifts from “What’s happening with performance?” to “which number should we trust?”
The problem usually isn’t a lack of reporting. If anything, teams have more dashboards and data than ever. The challenge is that those dashboards often grew across tools, channels and teams without a clear structure. Data isn’t unified. Dashboards contradict, and your marketing analysis gives you questions, not answers.
So why doesn’t your marketing reporting give you the key insights you wanted, and how can you build a reporting framework that you can act on?
This guide explains what marketing reporting is, why it often breaks down and how to build a reporting system that creates clarity and drives confident decisions.
What marketing reporting actually is
Marketing reporting is the process of collecting, organizing and presenting marketing performance data so teams can understand how effective marketing is.
Reports pull together data from multiple channels, such as ad platforms, analytics tools, CRM systems and email platforms.
You're probably already familiar with what that looks like in practice. Real-time digital marketing dashboards, scheduled performance reports, campaign reviews and executive summaries are the visible outputs of a reporting system. But they're only part of the picture.
Behind every report sits a structure that determines which data gets included, how it’s structured, how marketing metrics are defined and how performance is communicated across the organization. The purpose of marketing reports is to use your data to demonstrate impact. That data is also measured to understand how to optimize your marketing efforts to increase impact, and it’s analyzed to learn why something happened and what to do next.
Reporting vs. measurement vs. analytics
These three terms get used interchangeably, but they do different things. Confusing them is one of the more common reasons reporting systems become hard to fix.
Measurement defines what gets tracked and how success is evaluated. It's the set of decisions you make before any data gets collected, so you can determine which numbers actually reflect business performance. Get measurement wrong, and everything downstream is built on shaky ground.
Measurement includes:
- Attribution models (last-click, rules-based, multi-touch)
- Conversion tracking across channels and touchpoints
- Marketing mix modeling (MMM) for a top-down view of marketing channels
- Incrementality testing to understand the true impact of campaigns
- KPI definitions and how they connect to business outcomes
Analytics is the process of investigating data to understand what's happening and why. It's less about producing outputs and more about asking better questions from your marketing measurement results. You’ve got to dig into the numbers to find what's driving performance, not just what the dashboard shows on the surface.
Examples of analytics in practice:
- Identifying why conversion rates dropped after a campaign change
- Understanding which channels are actually influencing revenue, not just getting credit for it
- Spotting trends in customer behavior across the funnel
Reporting is how that information is communicated clearly and consistently to the people who need it. And in marketing, that's rarely just one audience.
Your campaign manager wants granular channel data to make daily optimization calls, and the CFO needs to know which marketing efforts contributed to revenue last quarter.
Measurement defines the data. Analytics investigates it. Reporting communicates it.
Many reporting challenges actually start upstream in how key marketing metrics are defined or how attribution is set up, not in the reports themselves.
When teams treat all three as the same thing, diagnosing problems becomes a lot more difficult.
Why reporting breaks
Modern marketing teams aren't short of data. Most have more of it than they know what to do with, but it’s scattered across Google Ads, Meta, CRM systems, offline sources and more. The problem isn't volume; it's structure and alignment.
When reporting grows organically rather than being designed as a system, eventually the data stops working together. Teams end up with fragmented views of performance, conflicting numbers and reports that take hours to build but don't actually tell anyone what to do next.
According to Funnel's 2026 Marketing Intelligence Report, over 80% of marketers say they don't have a clear signal of what's driving results. And that figure hasn't improved despite years of investment in data tools and technology.
Here's where it tends to go wrong.
Fragmented data sources
Every platform in your marketing stack measures performance in its own way. Google Ads, Meta and Google Analytics (GA4), for example, all use different tracking rules and attribution logic. As a result, Google might take credit for a purchase that happens on Tuesday, but Meta credits itself for the same conversion because the user viewed an ad on Facebook Monday evening. Even what a “conversion” means differs depending on where you look.
Without bringing this data together and standardizing it, you can’t get a complete picture of marketing performance or compare cross-channel performance. This is one of the most common and most costly reporting problems teams face. Even with more data than ever, 68% of marketers say they don’t have up-to-date visibility across channels, leaving them with incomplete views of performance.
Without a unified data foundation, it's almost impossible to understand how channels are working together, let alone make confident decisions about where to spend a limited marketing budget.
Dashboard sprawl
The instinct when reporting feels unclear is to build another marketing dashboard. A new one for the paid team, one for the SEO team and one for the weekly stakeholder update.
Before long, your company has dozens of dashboards with overlapping metrics, inconsistent definitions and no clear relationship to each other.
More dashboards don't create more clarity. They create more places for confusion to hide. Teams spend time reconciling numbers across reports instead of acting on them, and the original problem, a lack of shared understanding, gets worse, not better.
No clear ownership
Reporting systems tend to get messy when nobody is responsible for maintaining them.
Individual analysts or campaign managers build dashboards to solve immediate needs, but might not update them when the business changes. Metrics are added without a proper definition, and data sources drift out of sync.
Without clear ownership, reporting becomes a collection of one-off outputs rather than a structured system. The people who built some of your marketing report templates move on, and nobody quite knows how the numbers are calculated or whether they can still be trusted.
Reports that document marketing efforts but don't support decisions
This is perhaps the most common reporting failure of all and the hardest to spot. The beautiful report, complete with bells, whistles and key performance indicators, is built, shared and reviewed. Everyone nods along. And then nothing changes.
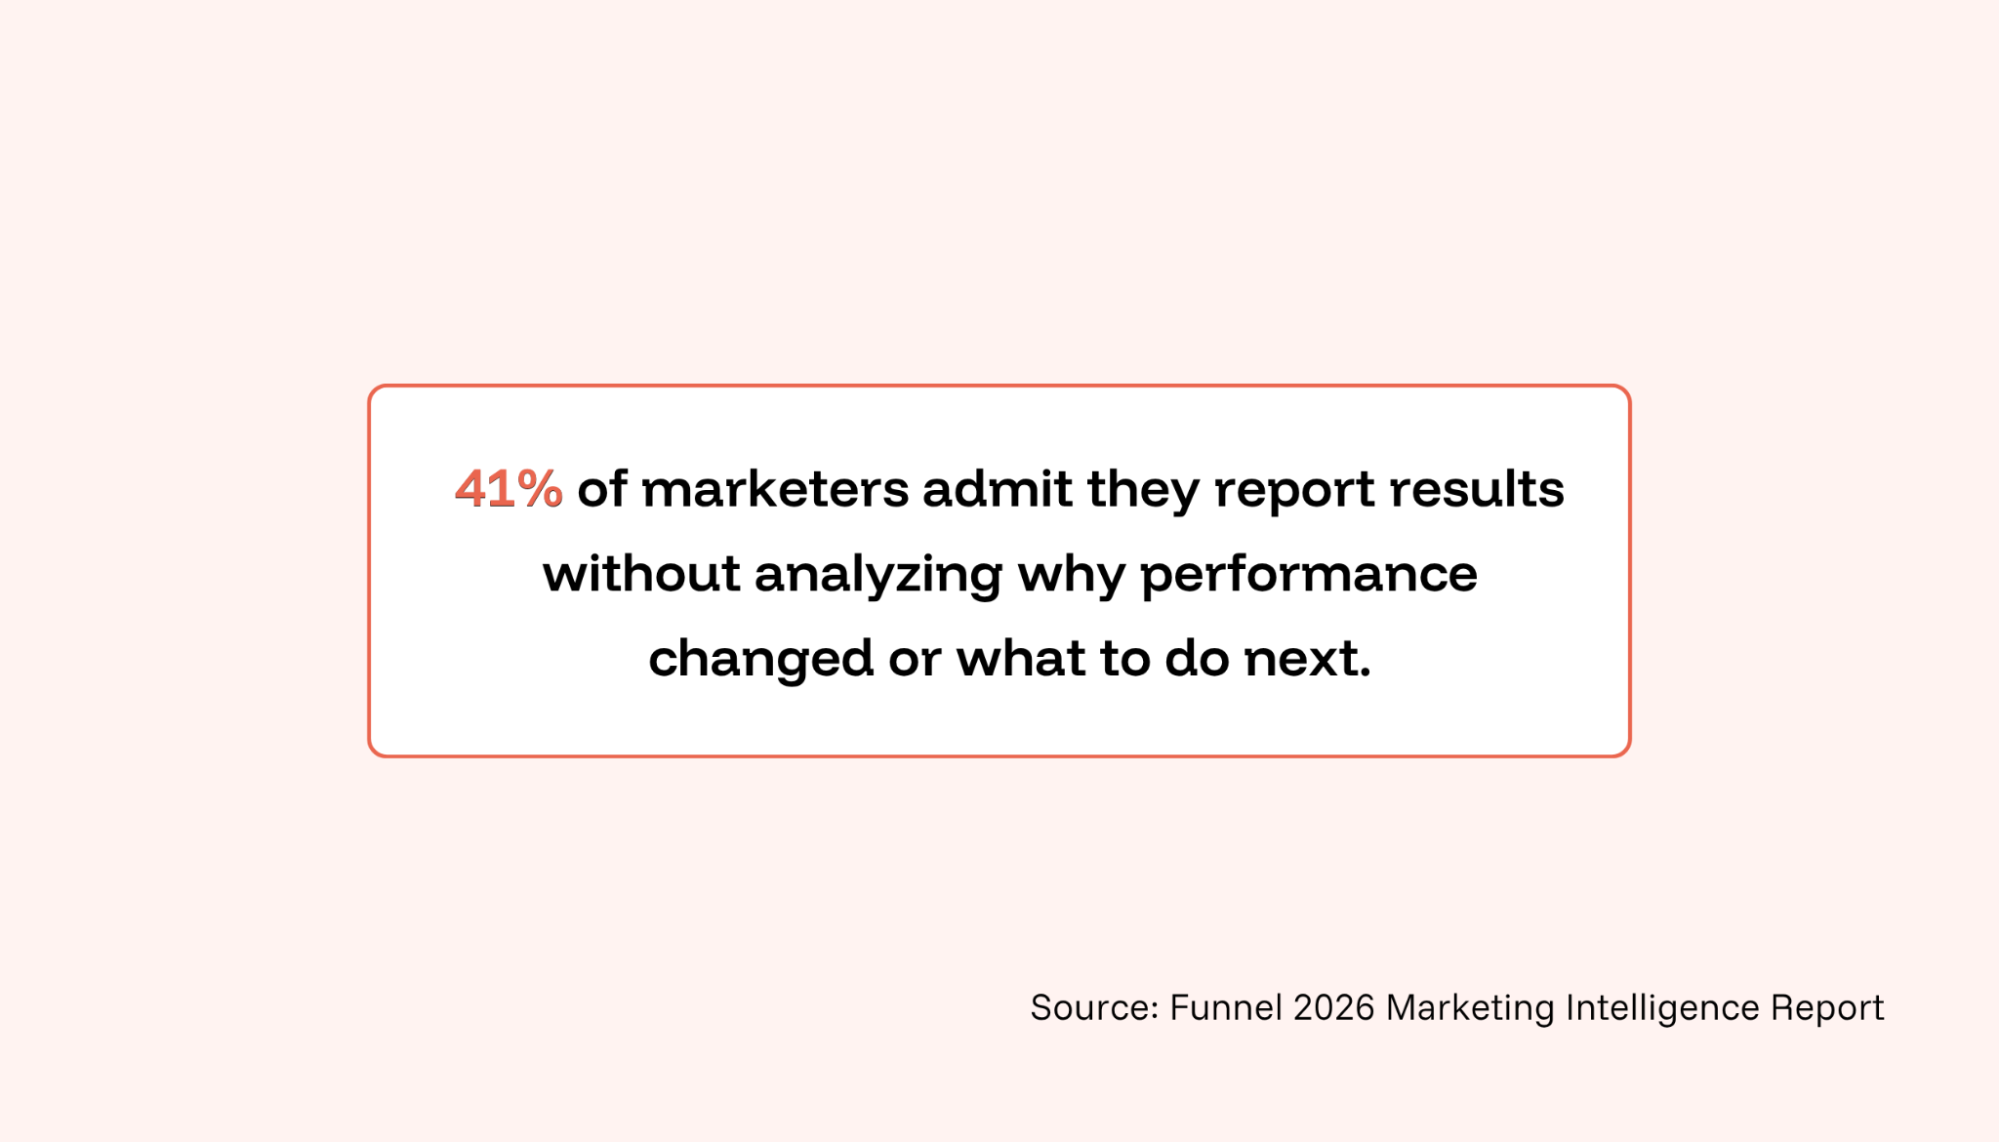
Funnel's research found that 41% of in-house marketers report results without analyzing the why behind them or identifying any actions to take. Reports full of charts and metrics can create the impression of looking organized without helping anyone decide what to do next.
When reporting stops at “here's what happened,” it becomes a documentation exercise rather than a management tool.
These aren't signs that reporting is fundamentally broken. There are signs that it grew without a plan. Most teams don't set out to build a fragmented, ungoverned mess of marketing dashboards. It just happens gradually, as new platforms are added, new stakeholders make requests and nobody steps back to look at the whole system to see if it makes sense.
Anatomy of a reporting system
A marketing reporting system is the set of structures that determine how marketing data is collected, standardized, interpreted and communicated across an organization. It’s what separates teams that trust their numbers from teams that spend every meeting questioning them.
When these components are in place, everyone from performance marketers to data analysts is working from the same understanding of performance. When they're not, you get the fragmentation: conflicting numbers, duplicate dashboards and reports that create more questions than they answer.
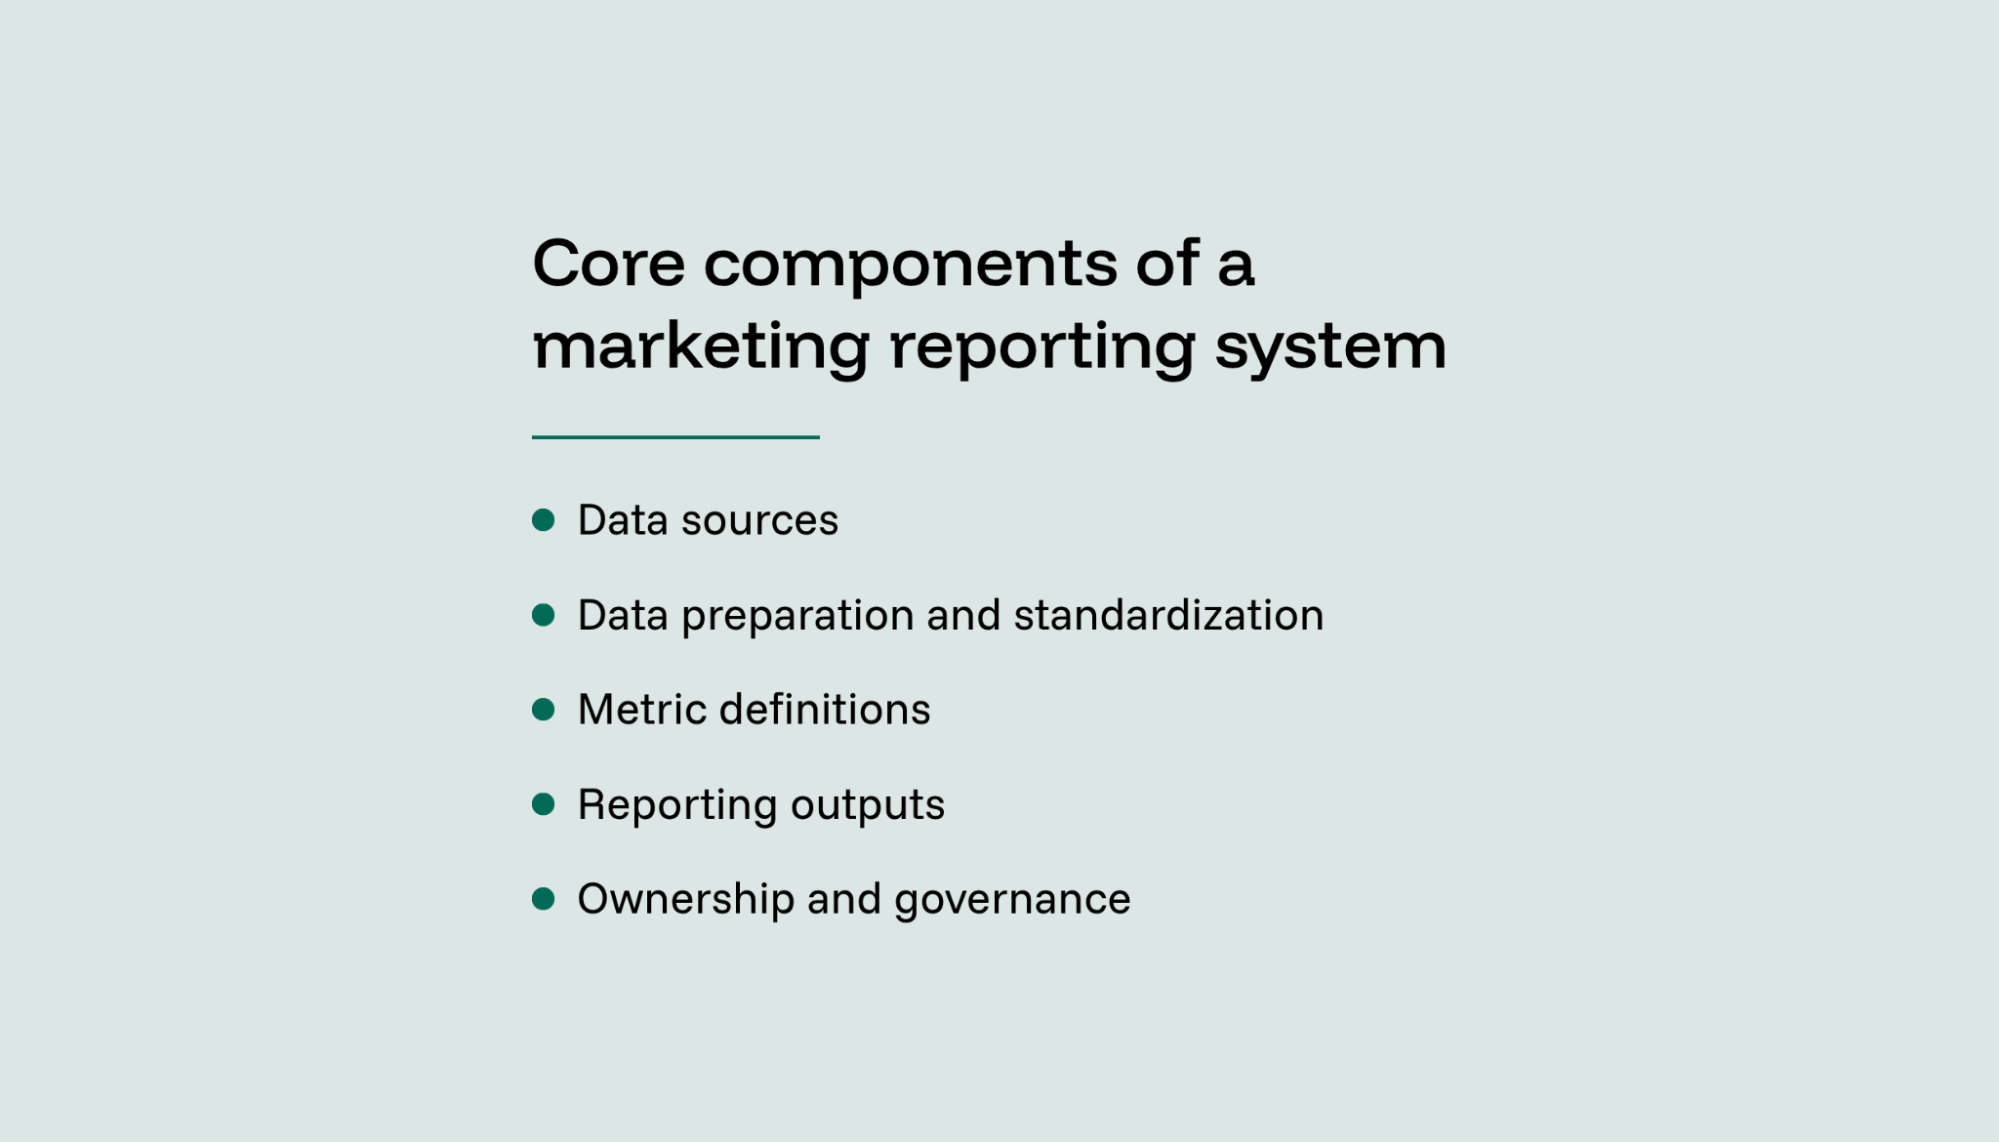
A solid reporting framework has five core components.
Data sources
Everything starts with where your data comes from. Marketing performance data lives across a wide range of platforms — paid channels like Google Ads, Meta and LinkedIn; web analytics tools like GA4; CRM systems like Salesforce or HubSpot; email platforms like Klaviyo and ecommerce platforms like Shopify.
But none of these talk to each other by default. For reporting to give you an accurate view of performance, data from these sources need to be unified and centralized. Only then can you look at marketing as a whole rather than a series of disconnected channel snapshots.
Data preparation and standardization
Raw data from multiple platforms isn't ready for reporting. Before you can use it, your data needs to be cleaned and standardized so that marketing metrics are consistent and comparable across channels and ready for analysis.
This includes:
- Normalizing campaign naming conventions so data can be filtered and grouped consistently
- Removing duplicates and irrelevant data
- Validating incoming data to catch errors before they reach your reports
This step is unglamorous but critical. Skip it, and your reports will look fine while quietly misleading you.
Metric definitions
What counts as a conversion? It depends on who you ask.
In Google Ads, it might include form fills, calls and page visits. In GA4, it might only count completed purchases. In your CRM, it's probably something else entirely.
A reporting framework needs a shared definition for every key metric. All teams need to agree and apply these definitions consistently across tools. Without that, performance conversations turn into debates over whose numbers are right, and budget decisions aren’t made with confidence.
Reporting outputs
Once data has been collected, cleaned and standardized, the reporting system produces the outputs that stakeholders actually see.
These include:
- Operational dashboards for marketing teams managing day-to-day performance
- Campaign reports that track digital marketing efforts shared on a weekly or monthly cadence
- Executive summaries that translate marketing activity into business outcomes for leadership.
The goal is to give each target audience exactly what they need to make better decisions — no more, no less. You don’t want to display as much information as possible.
Operational vs. executive reporting
Trying to make one dashboard work for every audience isn’t a good idea.
Both operational and executive reporting draw from the same underlying data and use the same metric definitions. But they translate that data differently depending on the audience and decisions that need to be made.
Operational reporting is for the people managing marketing day to day, like performance marketers, channel specialists, campaign managers and analysts. These reports are granular and updated frequently.
They're designed to answer questions like:
- Which ad sets are underperforming?
- Where is the cost per acquisition creeping up?
- Which landing page is converting better this week?
Typical operational reporting includes:
- Campaign performance dashboards tracking ad spend, clicks, conversions and ROAS by channel
- Pacing reports showing budget utilization against targets in real time
- Channel-level breakdowns across Google, Meta, LinkedIn and other platforms
- A/B test results and performance comparisons across creative or audience segments
Executive reporting is built for marketing directors, CMOs and leadership teams who need to understand marketing's contribution to business outcomes. They don’t need (or want) to know the granular mechanics of how marketing campaigns are running.
These reports are higher-level and updated less frequently. They’re focused on trends and impact over time.
This often looks like:
- Revenue contribution reports showing how marketing activity connects to the pipeline and sales
- Cross-channel performance summaries with top-line ROAS and customer acquisition cost trends
- Marketing's share of overall business growth over a given period
- Budget efficiency overviews showing return on total marketing investment
Why does separating these reporting layers matter?
Trying to build one dashboard that works for everyone usually means building one that doesn't really work for anyone. The CMO gets overwhelmed with information, or the campaign manager doesn't get enough detail.
When you separate operational and executive reporting, everyone gets a clearer picture and fewer questions in the meeting. People running campaigns can optimize more quickly, and those making marketing spend decisions can act with greater confidence.
It's the same data, just with different lenses. And both matter.
The marketing reporting maturity ladder
Not every team is starting from the same place. Some are still pulling data manually from five different platforms every Monday morning. Others have fully integrated systems where data flows automatically into clean, trusted reports that actually inform decisions. Most are somewhere in between.
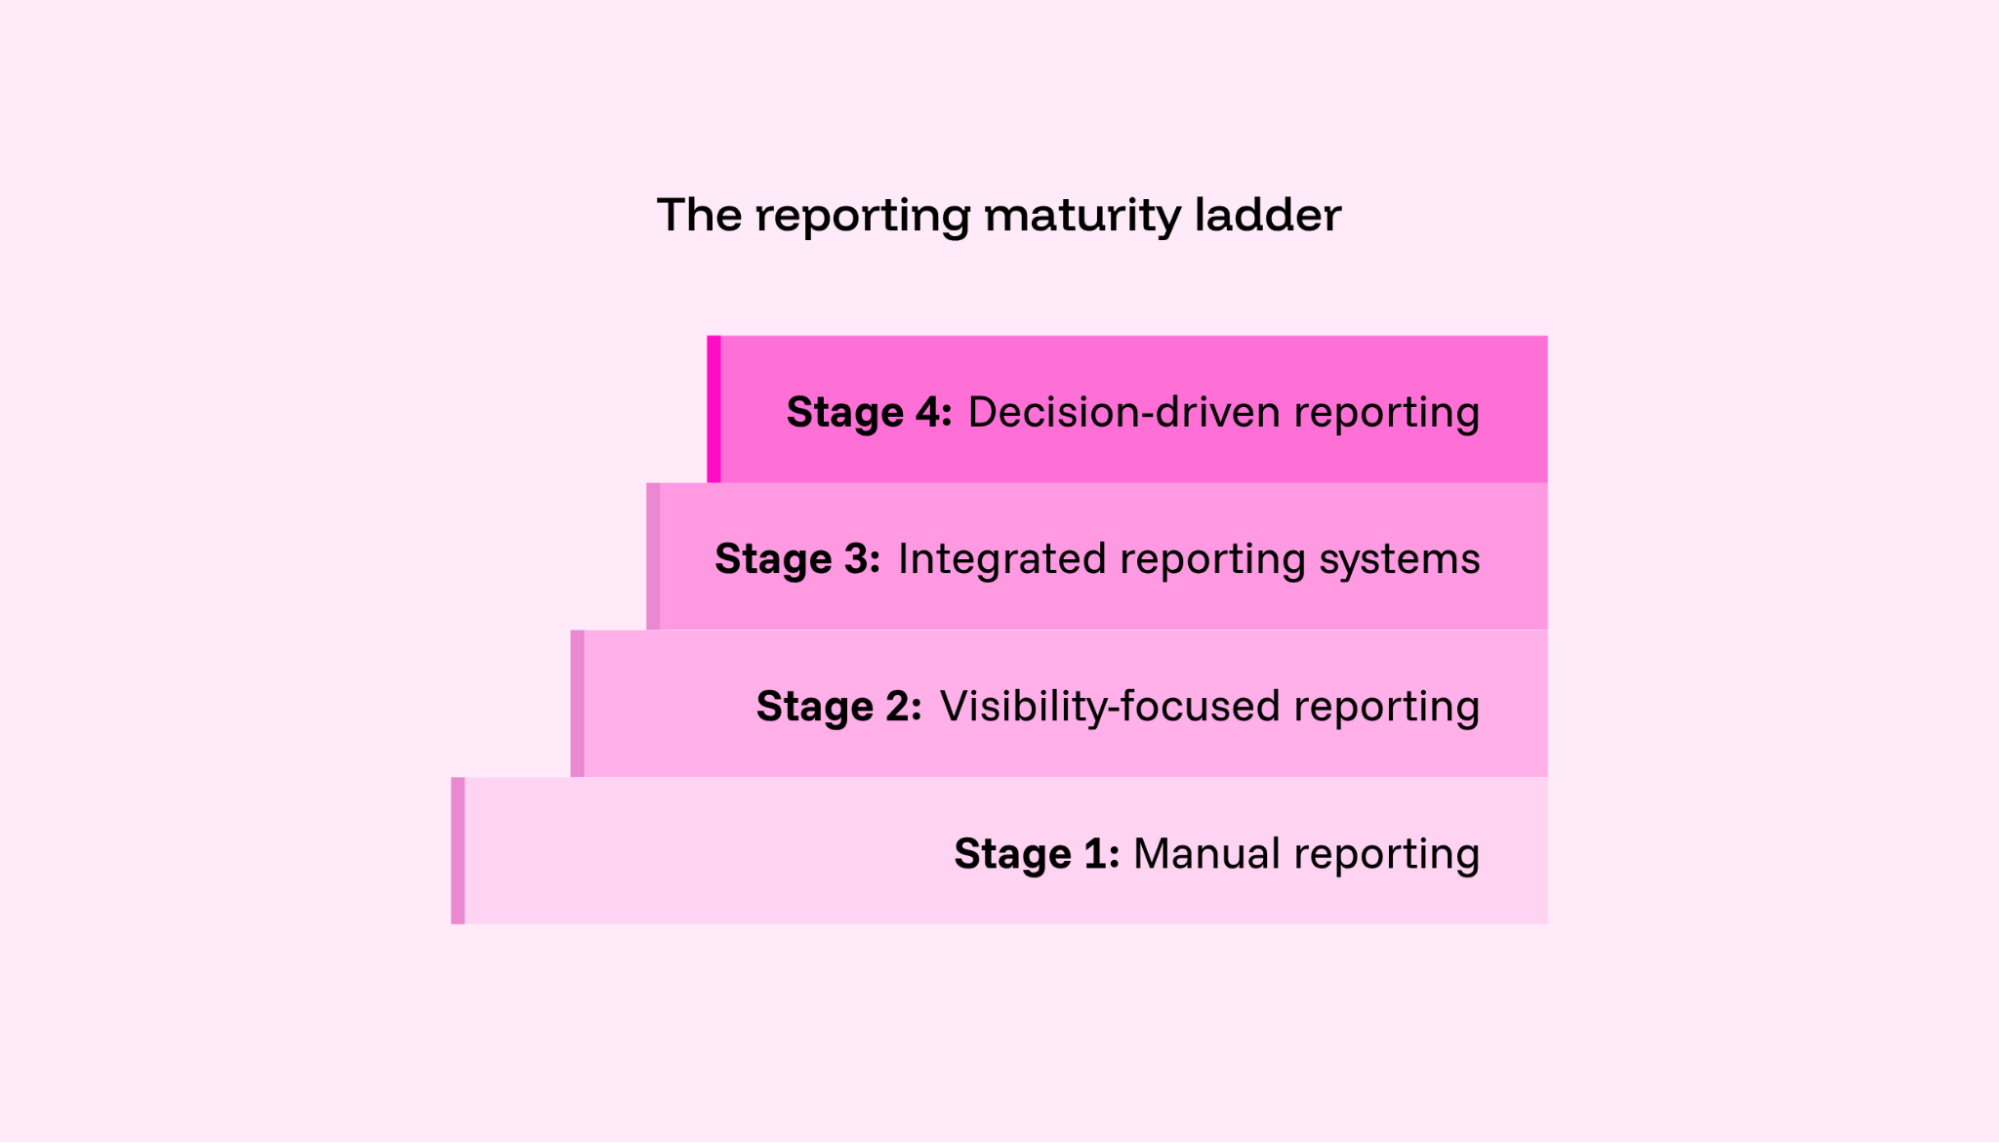
Understanding where your team sits helps clarify what to fix first and what good looks like on the other side.
Stage 1: Manual reporting
At this stage, reporting is almost entirely manual. Someone, usually an analyst or marketing manager, logs into each platform individually, exports the data and stitches it together in a spreadsheet. It works (just about), but it's slow, error-prone and doesn't scale.
The bigger problem is the time it costs. Regatta, an outdoor clothing brand with 120 stores across 55 countries, found that its marketing team was spending 16 hours per week just on data collection and reporting before implementing a more integrated approach. That's two full working days every week not spent on analysis, strategy or optimization.
Stage 2: Visibility-focused reporting
As teams grow, manual reporting becomes unsustainable. The next step is usually dashboards with data visualizations that present complex data in a digestible way.
Setting up dashboards involves connecting data sources to a BI tool or analytics platform so reports update automatically. This way, no one has to rebuild them from scratch each week.
This is a meaningful improvement. Teams get faster access to performance data and spend less time on the mechanics of reporting.
But having a lot of colorful tables and fancy graphs doesn't mean you can see clearly. Without standardized metrics and a clear connection to business goals, you end up with more dashboards than insights. That might explain why, despite most teams having dashboards, 86% of marketers still don't have a clear signal of what's actually driving performance.
Stage 3: Integrated reporting systems
This is where reporting starts to function as a system rather than a collection of outputs. Data from across the marketing stack is connected, standardized and stored in a central hub. Metric definitions are agreed upon, and attribution models are aligned.
Before moving to an integrated system, trivago had visibility into just 30% of its marketing reporting. After centralizing their data, they reached 100% coverage and gained hours back that used to disappear into manual data work.
Stage 4: Decision-driven reporting
At the most mature stage, reporting goes beyond a record of what happened. It's now an active input into planning, budget allocation and strategic decisions.
Reports are designed around the questions leadership and marketing teams are trying to answer, not just the metrics that are easy to pull.
Teams at this level are also more confident. Marketers who use advanced analytics consistently feel more empowered to experiment, make bolder recommendations and speak the language of business impact rather than marketing activity.
This is reporting as a strategic capability, not a weekly task.
Visualization principles for more effective marketing reports
Accurate, well-structured data is only half the job. If the people reading your reports can't quickly understand what they're looking at, the data isn't doing its job.
Good visualization is about making performance impossible to misread, not making dashboards look impressive.
Focus on the most important metrics
More metrics don't mean more insight. A report crammed with charts and numbers forces the reader to do the work of figuring out what matters. And most of the time, they won't. They'll skim it, nod along and leave the meeting without a clear takeaway.
Effective reporting starts by identifying the small set of metrics that reflect your marketing objectives and leading with those. Supporting metrics can live in the report, but they shouldn't compete for attention with the numbers that drive decisions.
Prioritize clarity over visual complexity
Modern BI tools make it easy to build visually sophisticated dashboards. That's not always a good thing. Gradient color schemes, dense chart layouts and too many data series on a single graph can make a report look thorough while actually making it harder to read.
The most effective dashboards tend to be the simplest ones: clear labels, consistent formatting and enough white space for the data to breathe. If someone has to study a chart to understand it, the chart isn't working.
Maintain consistency across reports
Consistency is what makes reporting trustworthy over time. When different reports use different metric definitions, different time periods or different visual formats, it creates friction and friction creates doubt.
Maintaining consistency means:
- Using the same metric definitions across every report and dashboard
- Presenting data across comparable time periods so trends are meaningful
- Applying consistent visual formats so stakeholders know what to expect each time they open a report
When reporting looks and feels the same every week, it becomes something your team can rely on rather than something they have to decode.
How reporting connects to measurement
Good reporting starts long before anyone opens a dashboard. It starts with measurement. The two are closely related, but they serve different purposes. Measurement decides what gets tracked. Reporting decides how it gets told.
Measurement defines the metrics
Measurement determines what data you collect and how you evaluate marketing performance.
- Which conversions count?
- How do you attribute a sale that touched six different channels?
- What does "revenue from marketing" actually mean in your organization?
You make these decisions before anyone builds a report. And if you get them wrong, no amount of good dashboard design will fix it.
Mismatched attribution windows and conversion tracking that only fires half the time aren't reporting problems. They're measurement problems, and they'll follow you into every report you build.
Reporting communicates the results
Once measurement is set up correctly, the job of digital marketing reporting is to translate that data into something stakeholders can understand and act on. That means:
- Monitoring performance over time to spot trends and changes
- Communicating outcomes across teams and to leadership
- Surfacing meaningful shifts in performance before they become bigger problems
- Supporting decisions about budget, strategy and channel mix
But even when the data is correct, reporting alone isn't enough.
Only 13% of marketing teams say continuous review and refinement is actually embedded in how they work. For everyone else, reporting marks the end of the process rather than the beginning of learning. They might work hard to put together the weekly or monthly marketing reports, but that's the end of the road. Which means actionable insights and intelligence that could shift the marketing strategy in all the right ways, turning marketing into a growth driver, are left sitting on the table.
It's a culture problem, not a data problem. And it's one of the clearest signs that a team has reporting without real measurement thinking behind it.
Measurement frameworks ensure that data is collected correctly, while reporting systems ensure that performance is communicated clearly. Together, they form the foundation of a reliable marketing data strategy.
Marketing reporting tools and technology
Modern marketing reporting doesn't happen inside a single tool. It relies on a stack of connected technologies that each play a different role, from collecting data, storing it and transforming it to finally presenting it in a way teams can use to stop guessing and start deciding.
Understanding how these layers fit together helps explain why reporting breaks when one of them is missing or unreliable.
Data connectors
Before you can report on anything, you need to get your data out of the platforms where it lives and into a place where it’s combined and easier to analyze. Google Ads, Meta, TikTok Ads, Pinterest, MailChimp, you name it. They all hold a piece of the picture.
Data connectors handle that job, automating the extraction process so data flows continuously without someone manually exporting CSVs.
Managed connectors matter more than most teams realize. Connectors that break when a platform updates its API or pulls incomplete data quietly corrupt everything downstream. By the time the problem shows up in a report, it can be hard to trace back to the source.
Data storage
Once data is collected, it needs to live somewhere reliable. For many teams, this is a data warehouse or a data hub built for marketing data. These are centralized environments that store, preserve and organize raw marketing data so it's always available for analysis.
Good data storage means your historical data stays intact even when platforms change. You can always go back and recheck numbers from previous periods.
Data transformation
Raw data from different platforms isn't comparable by default. If you pull data from ten platforms, you'll get ten different versions of the same story.
Transformation reconciles them into one. It’s the process of cleaning, standardizing and organizing that data so it can be used in reporting. Marketing data integration tools can automate data transformation, taking care of currency conversions, naming conventions and other issues so your data is ready for measurement, reporting and analysis. They use connectors to pull data, store and transform it.
BI dashboards and reporting tools
You've got clean data, and it's all in one place. Now what?
Business intelligence (BI) tools like Looker Studio, Power BI and Tableau turn it into the dashboards and reports your team will actually look at.
These tools are powerful, but they're only as good as the data feeding them. A well-designed dashboard built on inconsistent data is still an unreliable report.
Reporting automation
Manual reporting is a headache most marketing teams know well.
Logging into six platforms, pulling exports, copying numbers into a spreadsheet, realizing something doesn't add up and then starting over. It's the kind of work that fills a morning and leaves you no closer to actually understanding performance.
Marketing automation tools take that off your plate. Reports update automatically, and data stays fresh and reliable. Your team can spend time analyzing performance rather than compiling it.
And yet, just 12% of in-house marketers have automated their data tasks extensively. For everyone else, a good chunk of the week is still disappearing into work that could just be running in the background.
AI-powered analysis and reporting
AI assistants and large language models (LLMs) like ChatGPT, Claude and Gemini are starting to change how marketers interact with performance data.
Rather than opening multiple reports and manually searching for answers, marketers can ask questions in plain language, generate summaries, explore trends and even draft stakeholder updates using AI.
But AI doesn’t change the underlying challenge: the quality of the answers depends on the quality of the data.
When AI is given access to individual platforms in isolation, it struggles to reconcile differences in attribution models, campaign structures and metric definitions. The result can be fast answers that sound convincing but aren’t always grounded in a complete view of performance. A Deloitte survey found that data-related issues have led 55% of organizations to avoid certain generative AI use cases altogether.
As AI becomes more embedded in reporting workflows, the importance of a strong data foundation only grows. Deloitte reports that 75% of organizations are increasing their investments in data management because of generative AI.
Unified, standardized and well-defined data allows AI tools to work across channels rather than treating each platform as a separate source of truth. Companies are looking for ways to connect AI tools to unified marketing datasets rather than individual platforms, providing a more complete and consistent view of performance.
Emerging standards, such as the Model Context Protocol (MCP), are making it easier for AI to access centralized data and business context through a single connection. With a more complete view of performance, marketers can spend less time gathering data and more time interpreting it.
Marketing reporting as a foundation for decision-making
Marketing reporting has come a long way from manually pulling numbers into spreadsheets and hoping they tell a coherent story. But for a lot of teams, that's still closer to reality than anyone wants to admit.
The good news is that the path forward is clearer than ever. When data sources are connected, metrics are standardized and reports are designed around the decisions people need to make, reporting stops being a weekly chore and becomes genuinely useful.
This shift doesn't happen by accident. It happens when teams stop treating reporting as an output and start treating it as a system. Get that right, and reporting becomes one of the most valuable investments a marketing team can make. Not because it produces better dashboards, but because it produces better decisions.