
Data is everywhere — it's the lifeblood of your business. However, using that wealth of information is often easier said than done, especially when dealing with non-aggregatable data.
But what exactly is non-aggregatable data, and how do you work with it? This guide focuses on why certain data sets must be approached with caution so that you can maintain data accuracy. Let's jump in.
What is non-aggregatable data?
Technically, "non-aggregatable" data isn't a term. However, it does describe data that shouldn't (or cannot) be aggregated.
So, to understand this term, you must first determine what aggregated data is.
Aggregated data is the data you collect from multiple sources that are compiled into summary reports. The end goal is to uncover valuable insights. You achieve this by aggregating data to reduce the number of rows needed. An example would be your advertising data from last year. In raw form, you could have 365 rows with metrics like cost, clicks and conversions. And if you advertise on Facebook and on Google, this would result in 2 times 365 rows.
Aggregating that large data set could result in a table with just 12 rows (1 for each month) and perhaps also one 'Cost' data point per row, instead of having one for Google, and one for Facebook.
Raw data can be overwhelming
The best way to visualize this process is by thinking about all the raw data you collect and how overwhelming that information can be. Especially when your are trying to see the big picture, and understand your marketing performance. To tackle this, data aggregation organizes all separate data points (your raw data) into buckets so you can quickly and easily see patterns and trends.
Related: Are you responsible for these common data aggregation mistakes?
How non-aggregatable data differs, and why that matters
You may have seen the term non-aggregate in Tableau concerning non-aggregatable fields. For example, you may have seen the error message "cannot mix aggregate and non-aggregate arguments."
You can aggregate certain metrics, like clicks or costs, but there is a lot of data that you cannot aggregate. For example, if you try to aggregate the click-through rate for several queries, you could end up with a faulty number. Instead, you must use the aggregated number of clicks and aggregated number of impressions to calculate the CTR for a query set, like the one pictured below.
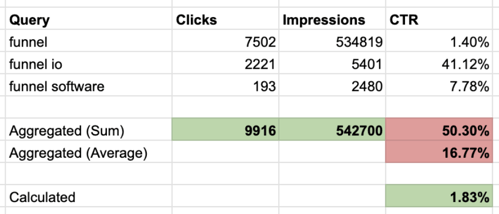
Clickthrough rate is an example of non-aggregatable metrics
You can also see why this is the case fairly quickly — the number of impressions for "Funnel" is way higher than for the other keywords. That is why you need to use a weighted average for CTR instead of aggregating the data.
So, non-aggregatable data includes metrics that cannot (or should not) be added or summed. When they are, without awareness of the potential consequences, the credibility of your data can suffer. You could then make poor decisions based on inaccurate information.
Some data points cannot be aggregated because their value depends on a higher granular level of data — which is information that is not given. So, without the "full" picture, you could significantly play down or exaggerate your data.
What are non-aggregatable metrics?
Examples of non-aggregatable metrics include the following:
- Follower count - While you can add up your follower count on LinkedIn, TikTok and Instagram, for example, you can not aggregate the follower count you have this week and the follower count you had last week.
- Email subscriber count - Same as above.
- Unique impressions - This is considered a non aggregatable metric because the same person may be following you on both Instagram and TikTok. Adding up followers from both platforms, will give you a skewed image of how many unique people you reach with your social channels.
- Reach - The same as above
- Cost per click (CPC) - This is a non aggregatable metric because it is an average. If you want to know your average CPC over different ad platforms, try calculating a weighted average.
- Click-through rate (CTR) - The same as with CPC, and explained in the example earlier in this blog post.
If you try to aggregate these metrics, you'll get false results. So, the most important thing to take away from this is an awareness of these metrics during an analysis. Don't place the quality of your data at risk.
Related: 2023's top marketing KPIs explained
Recognize non-aggregated data — and put it to use
Before you pump the breaks on the metrics described above, keep in mind that these metrics are not useless. They offer immense value and are excellent at measuring what they are intended to measure. The key is understanding their limitations so you don't misperceive data and knowing how to work with non-aggregated data.
Investing in a marketing data hub that eliminates manual reporting and data silos can significantly boost your performance while gaining the support you need to utilize your non-aggregatable metrics.
In summary
The most crucial takeaway is to know what metrics should not be aggregated. To recap:
- Any running totals, like subscribers, number of followers, and inventory.
- Unique metrics, such metrics include reach or unique impressions.
- Calculated KPIs, like CPC, CTR, and conversion rate.
You'll get inflated values if you try to aggregate any of the metrics above. You'd need the most granular breakdown possible to perform data aggregation for these metrics — which will rarely happen. So, know their limitations and when these limitations apply. For example, if you want to perform an analysis concerning Facebook reach, as long as you allow the provider to complete the process (in this case, Facebook), you can gain insight from this data.
It is when you try to extract that data and do your own calculations that you'll run into issues. Understanding this can help ensure your data yields more realistic values, protecting your business from misguided, costly decisions.
FAQ
What is a metric?
A metric is a quantitative value in a data set. It is a standard of measurement that businesses use to track, monitor and assess the success or failure of various business processes. Metrics are used in different contexts, such as marketing, where they might measure things like the cost of acquiring a new customer, the performance of an advertising campaign, or the number of users visiting a website.
Also read: Metrics & dimensions explained.
How can I identify non-aggregatable metrics in my data set?
Identifying non-aggregatable metrics often requires a deep understanding of your data and the context in which it was collected. Non-aggregatable metrics are typically those that lose their meaning or become misleading when summed up. These can include averages, ratios, percentages, or any metric that is calculated based on two or more other metrics. See our blog on misleading visualizations to go deeper.