
Each time a person visits your website, Google Analytics will try to figure out how they got there. That is, what link they clicked or if they typed your site’s address directly. Google Analytics will also be able to tell you if the person made a download, signed up or completed a purchase.
Provided you’ve implemented things correctly, Google Analytics does a pretty good job at these things.
However, one thing Google Analytics is clueless about also happens to be vital in order for you to make meaningful online marketing decisions: how much you paid to attract these visitors.
Without this information you have no idea of whether your advertising is profitable, where to spend more and where to spend less. Fortunately, it is possible to import cost data to Google Analytics. You can do this manually or use a tool. As far as tools go there are a couple of alternatives out there; Funnel’s Google Analytics Cost Uploader being one of them.
Probably the most common question I see on the topic of importing cost data to Google Analytics is what you’re actually able to do with the data after importing it. In this post we’ll take a look at what options you have.
Where will the imported data be available?
Since there are many different kinds of analyses you might want to run with your imported cost data, I’ll try to answer this question by outlining all Google Analytics reports where you’ll be able to use it.
After setting up your import, you’ll find the data available in reports in two of the Google Analytics report sections: Acquisition and Conversions. In addition, the cost data can be used when creating dashboards and custom reports.
With the exception of custom reports, all reports in Google Analytics have fixed metrics. This means cost data will be available in certain reports. For Acquisition, this report is Cost Analysis.
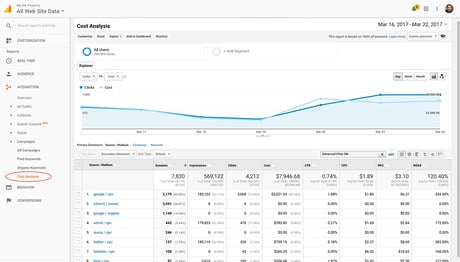
The Cost Analysis report
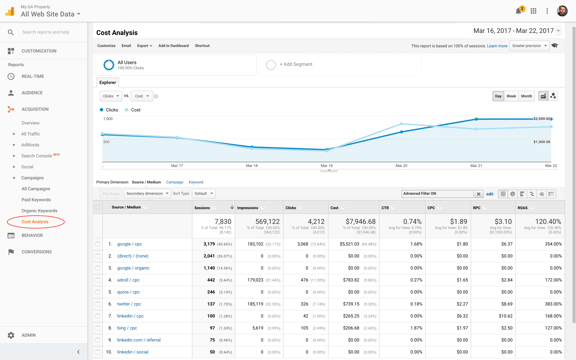
This report lets you track cost, impressions and clicks, along with a few calculated metrics. These include cost per click, revenue per click and return on advertising spend.
The segmentation options you have depends on how your cost data was imported. If you imported it by source and medium only, you’ll be able to see cost per source, medium and per source / medium. If you imported it by source, medium and campaign, you will be able to see cost per any combination of those three dimensions. If you’re unsure of how Google Analytics standard dimensions for segmenting traffic works I can recommend our guide on the topic: Google Analytics UTM tagging best practices.
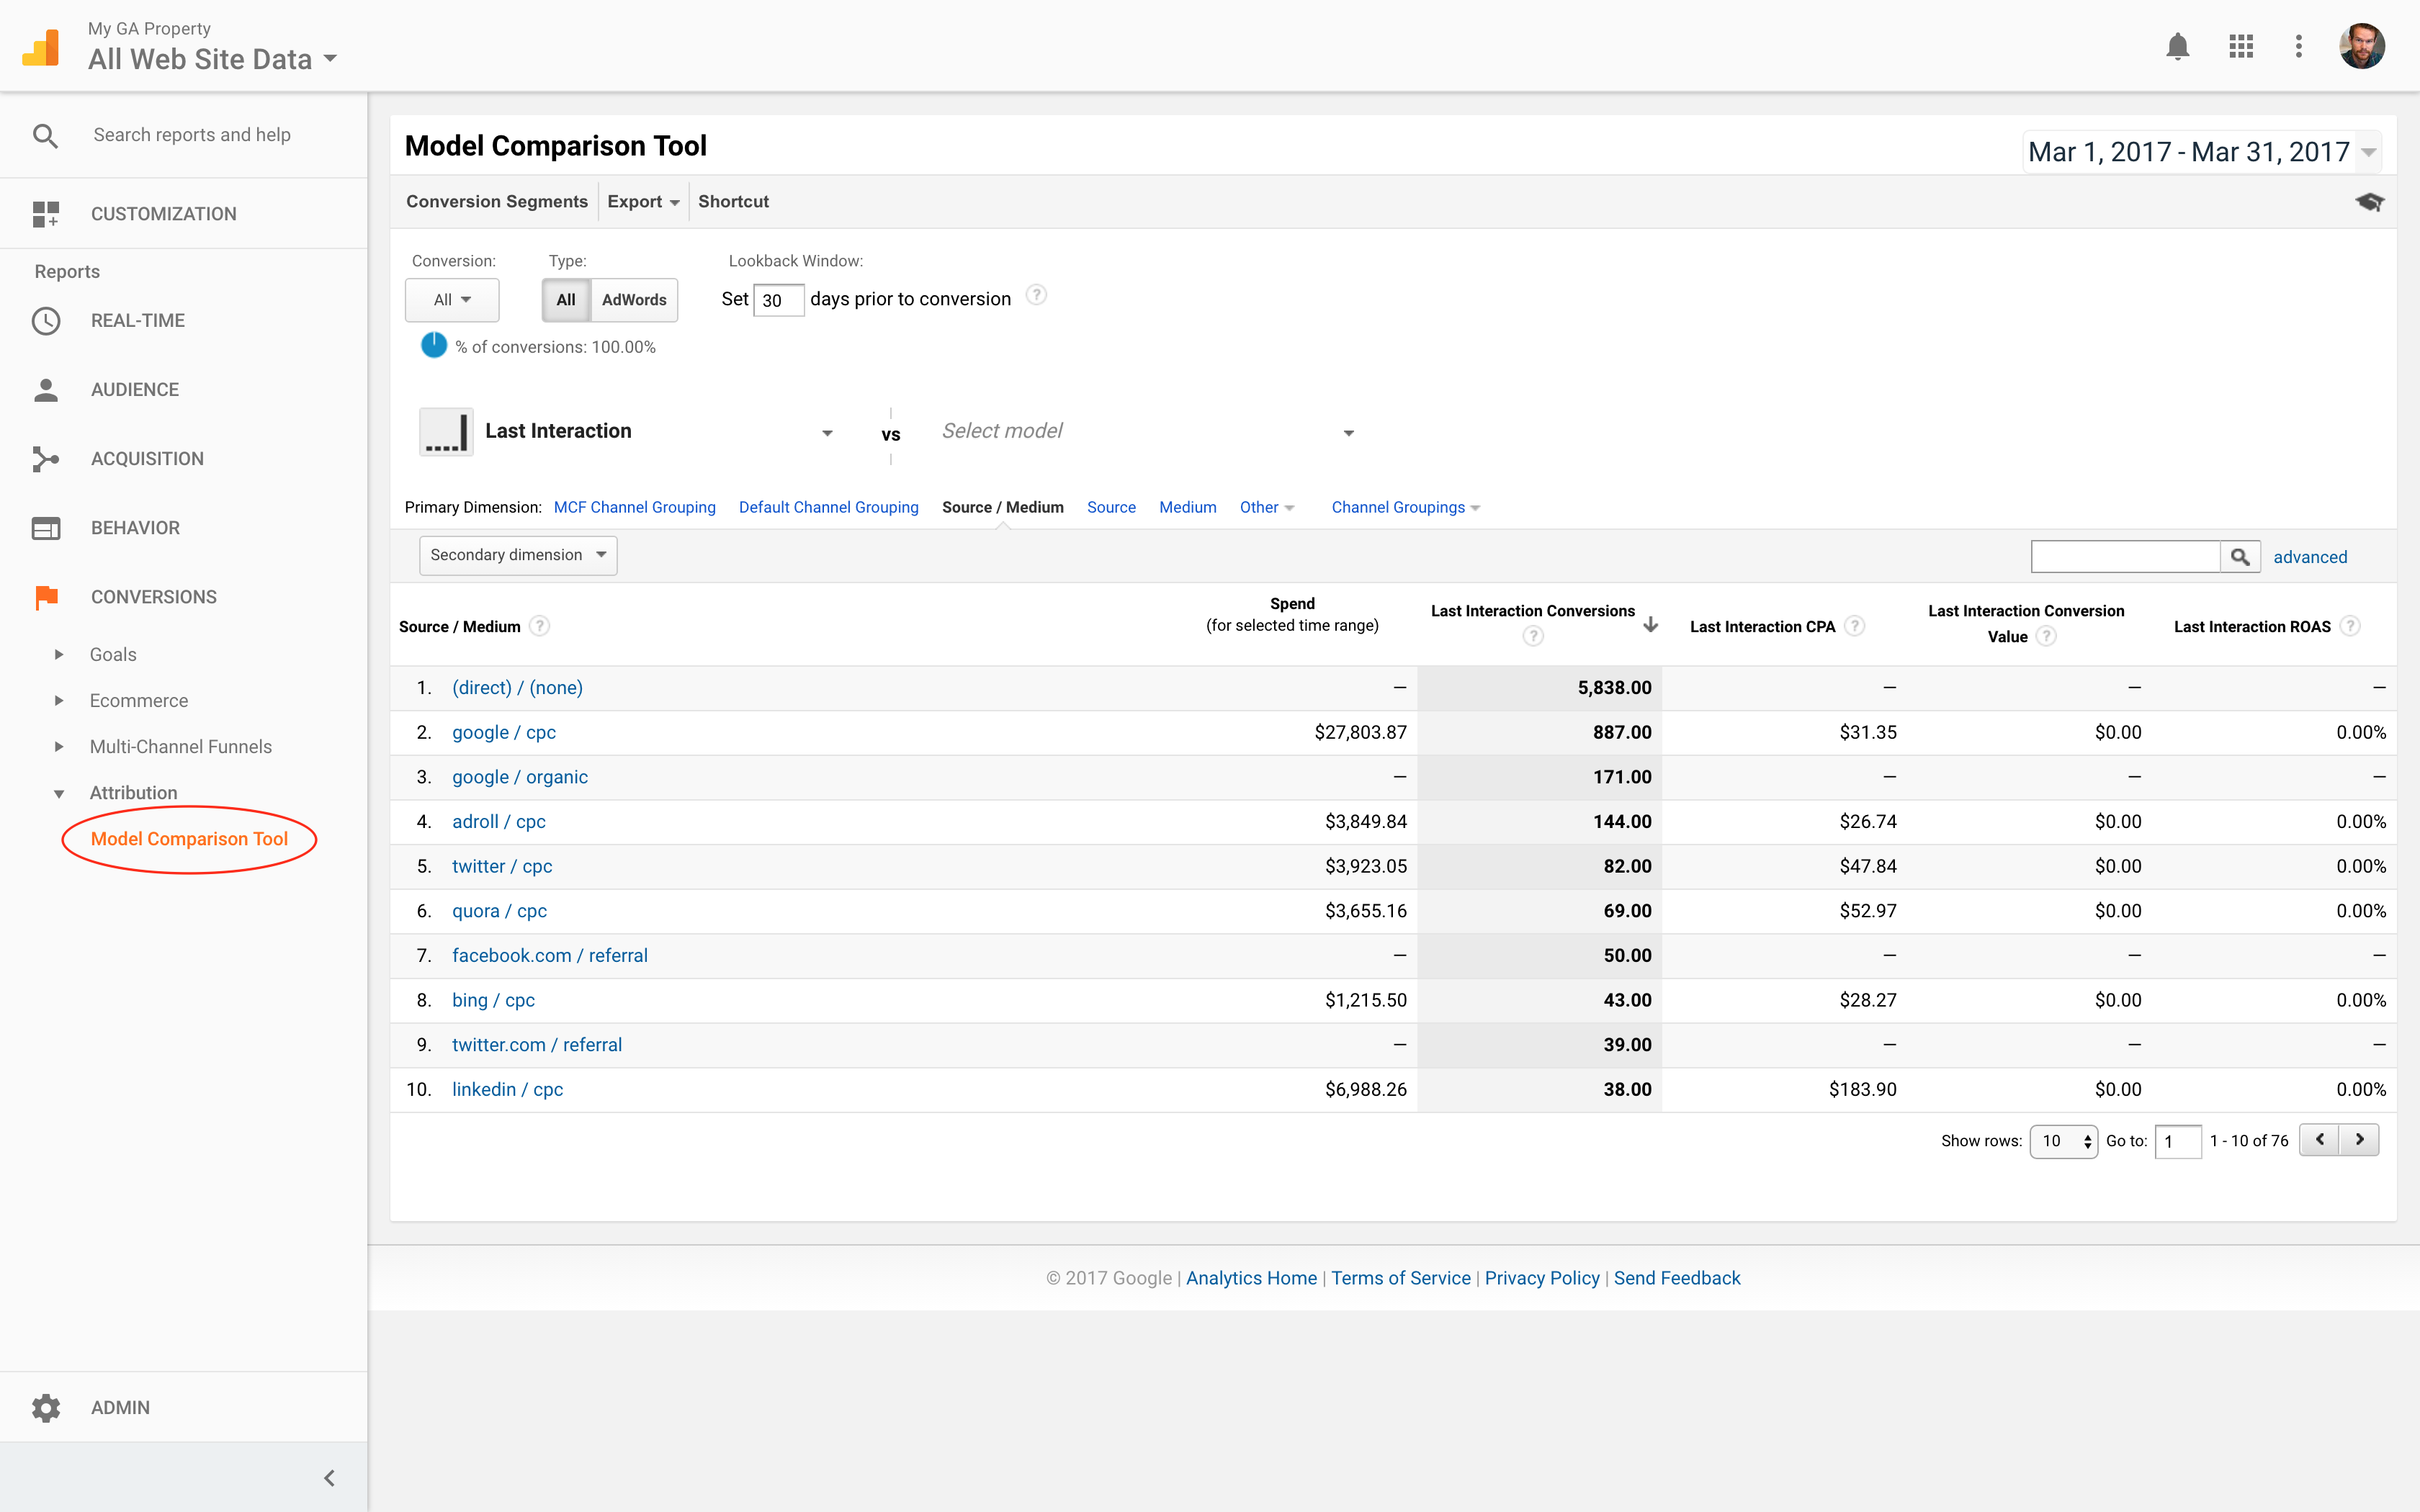
The second report where your imported cost data will show is the Model Comparison Tool.
The Model Comparison Tool
Having cost data available in the Model Comparison Tool is quite handy as it lets you get a better idea of the effect of your marketing spend. Without it, you can still tell what role a certain advertising tactic is playing in your conversion funnel, but you won’t be able to understand whether it is a sound investment or not.
With cost data available when comparing different attribution models you’ll be able to make informed decisions on whether to increase or decrease your spend on certain activities.
Lastly, the imported cost, clicks and impressions are, just like most metrics in Google Analytics, available for use in dashboards and custom report.
Dashboards and Custom Reports
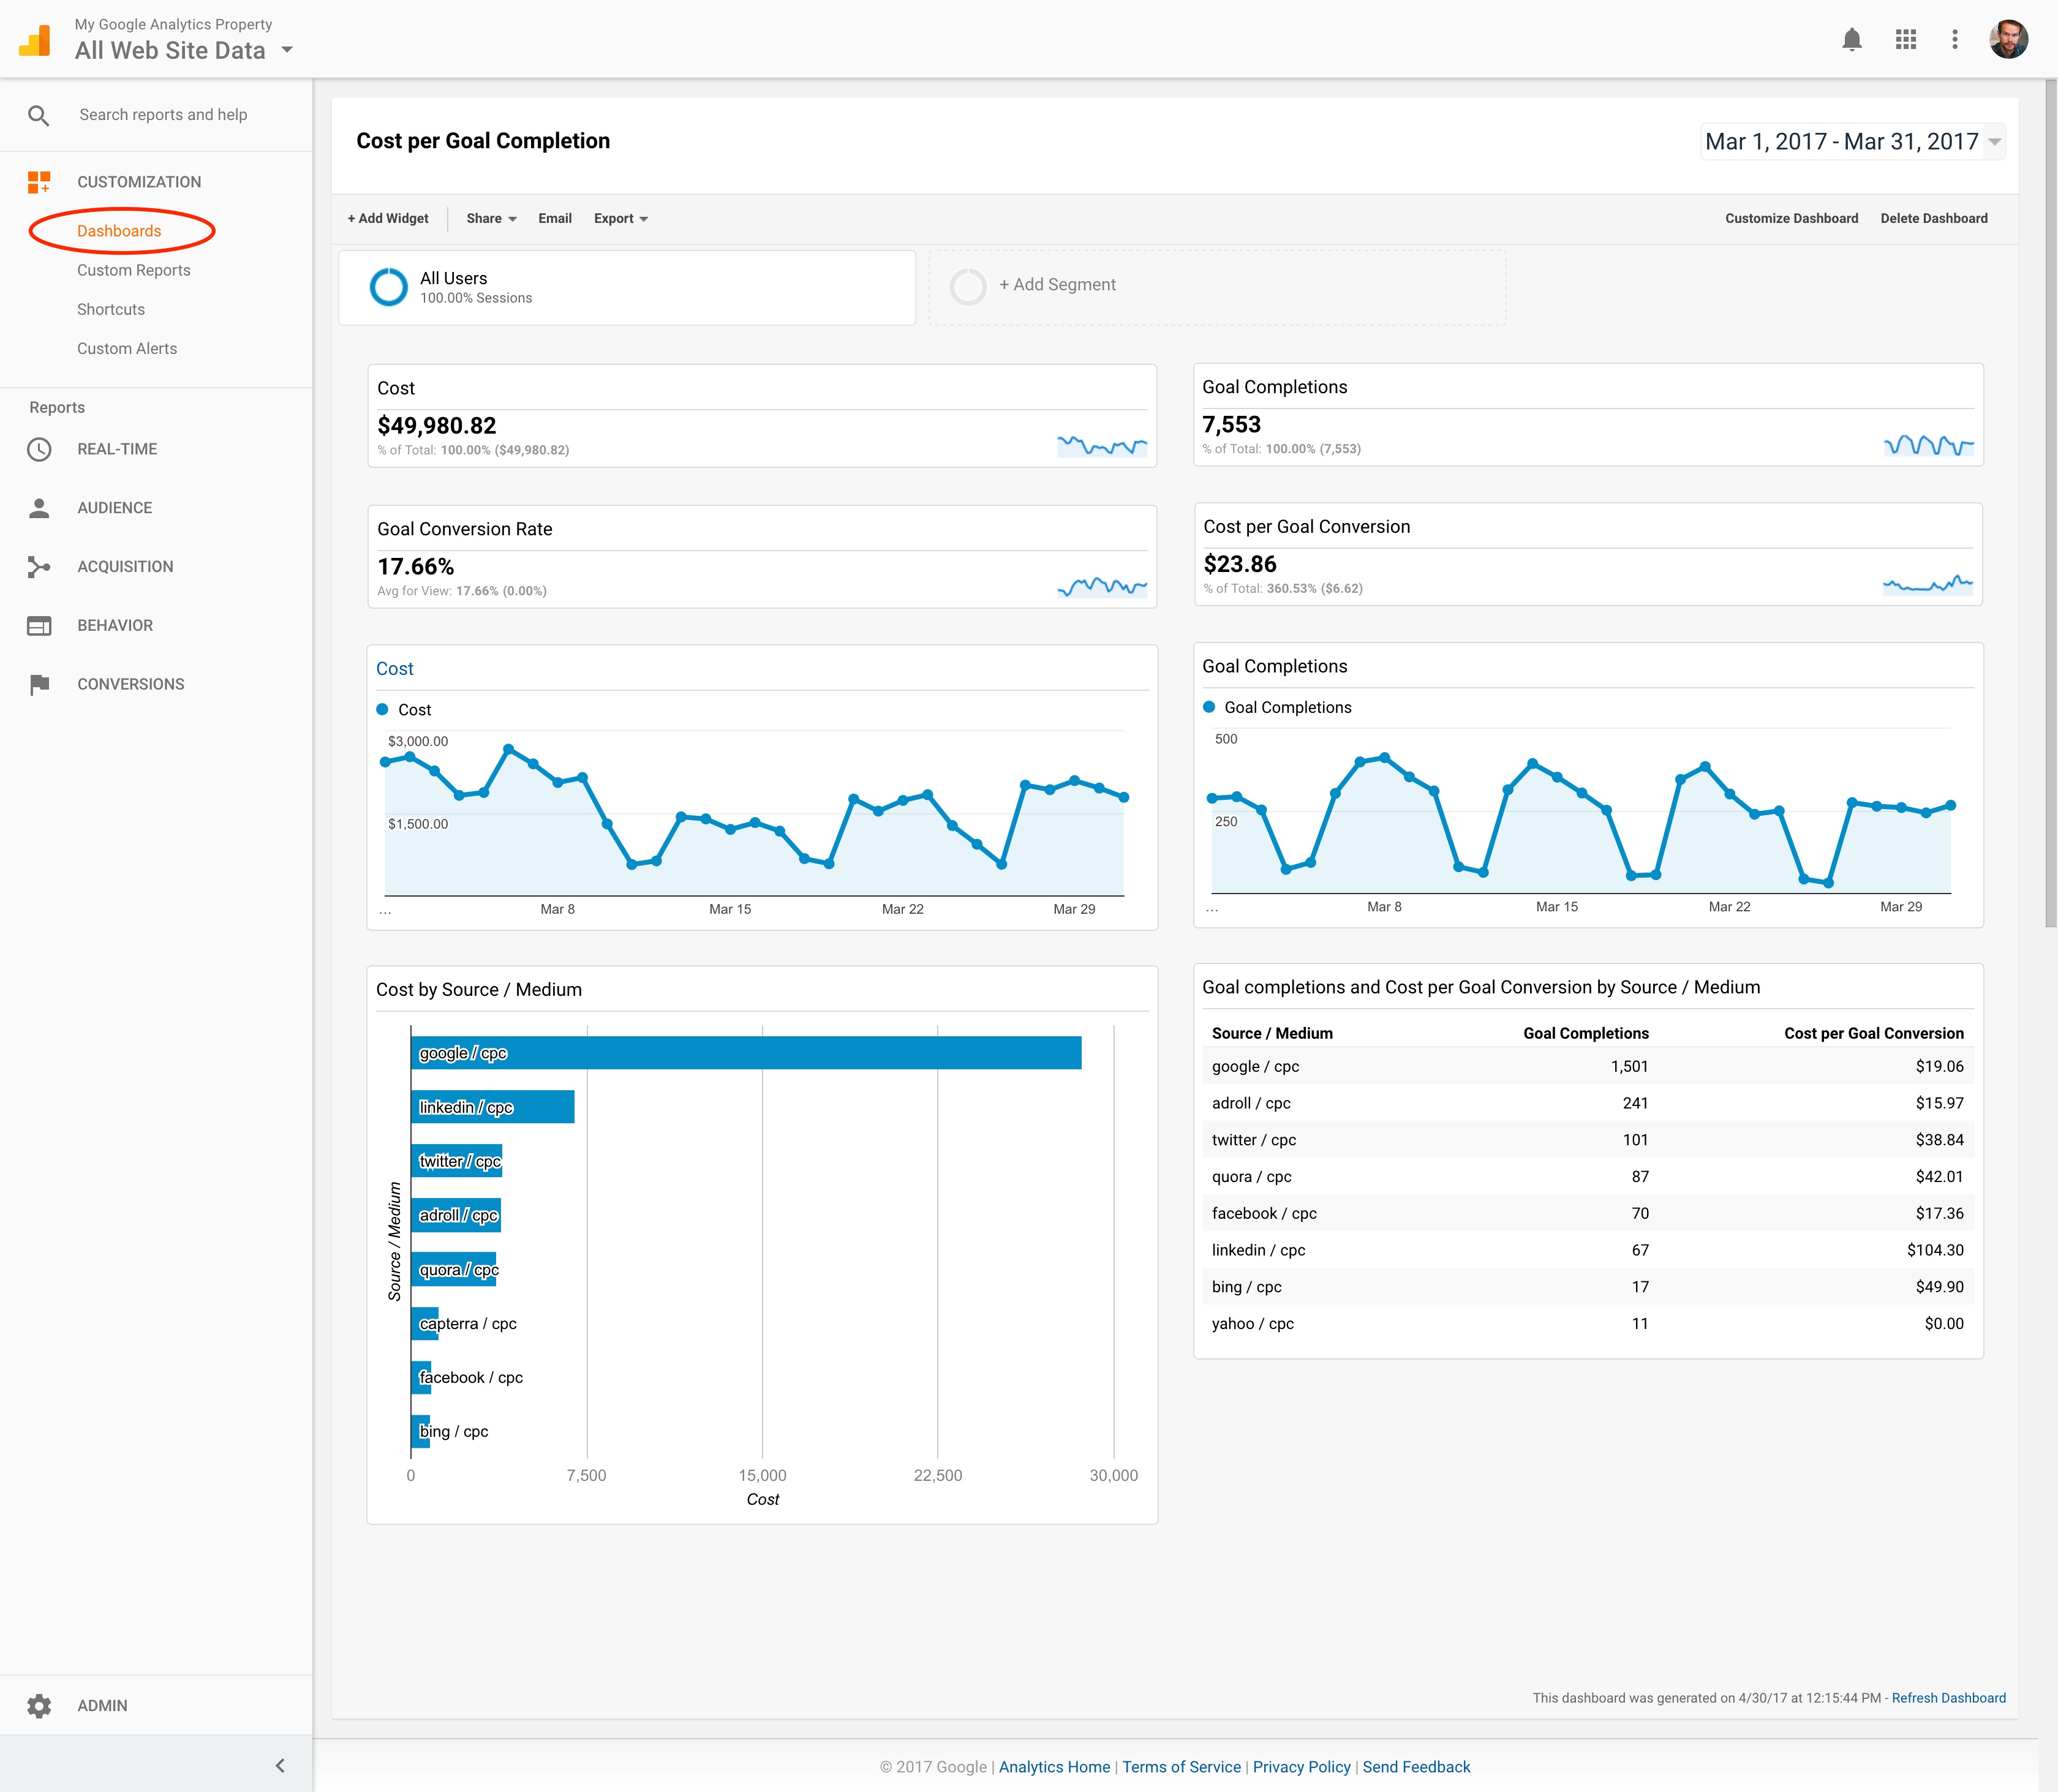
Perhaps the most valuable way to use imported cost data in Google Analytics is to build your own dashboards and custom reports. The imported data can be used just like any other metric and, as pointed out earlier, segmented depending on how it was imported.
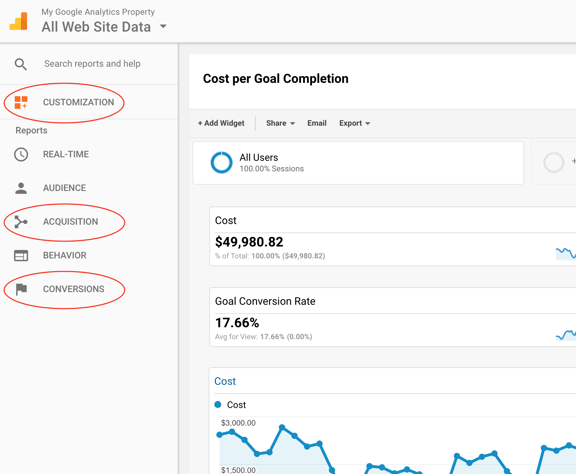
If you, for example, want a dashboard that gives a quick overview of the cost of goal conversions with a breakdown per source / medium, you could build something like this:
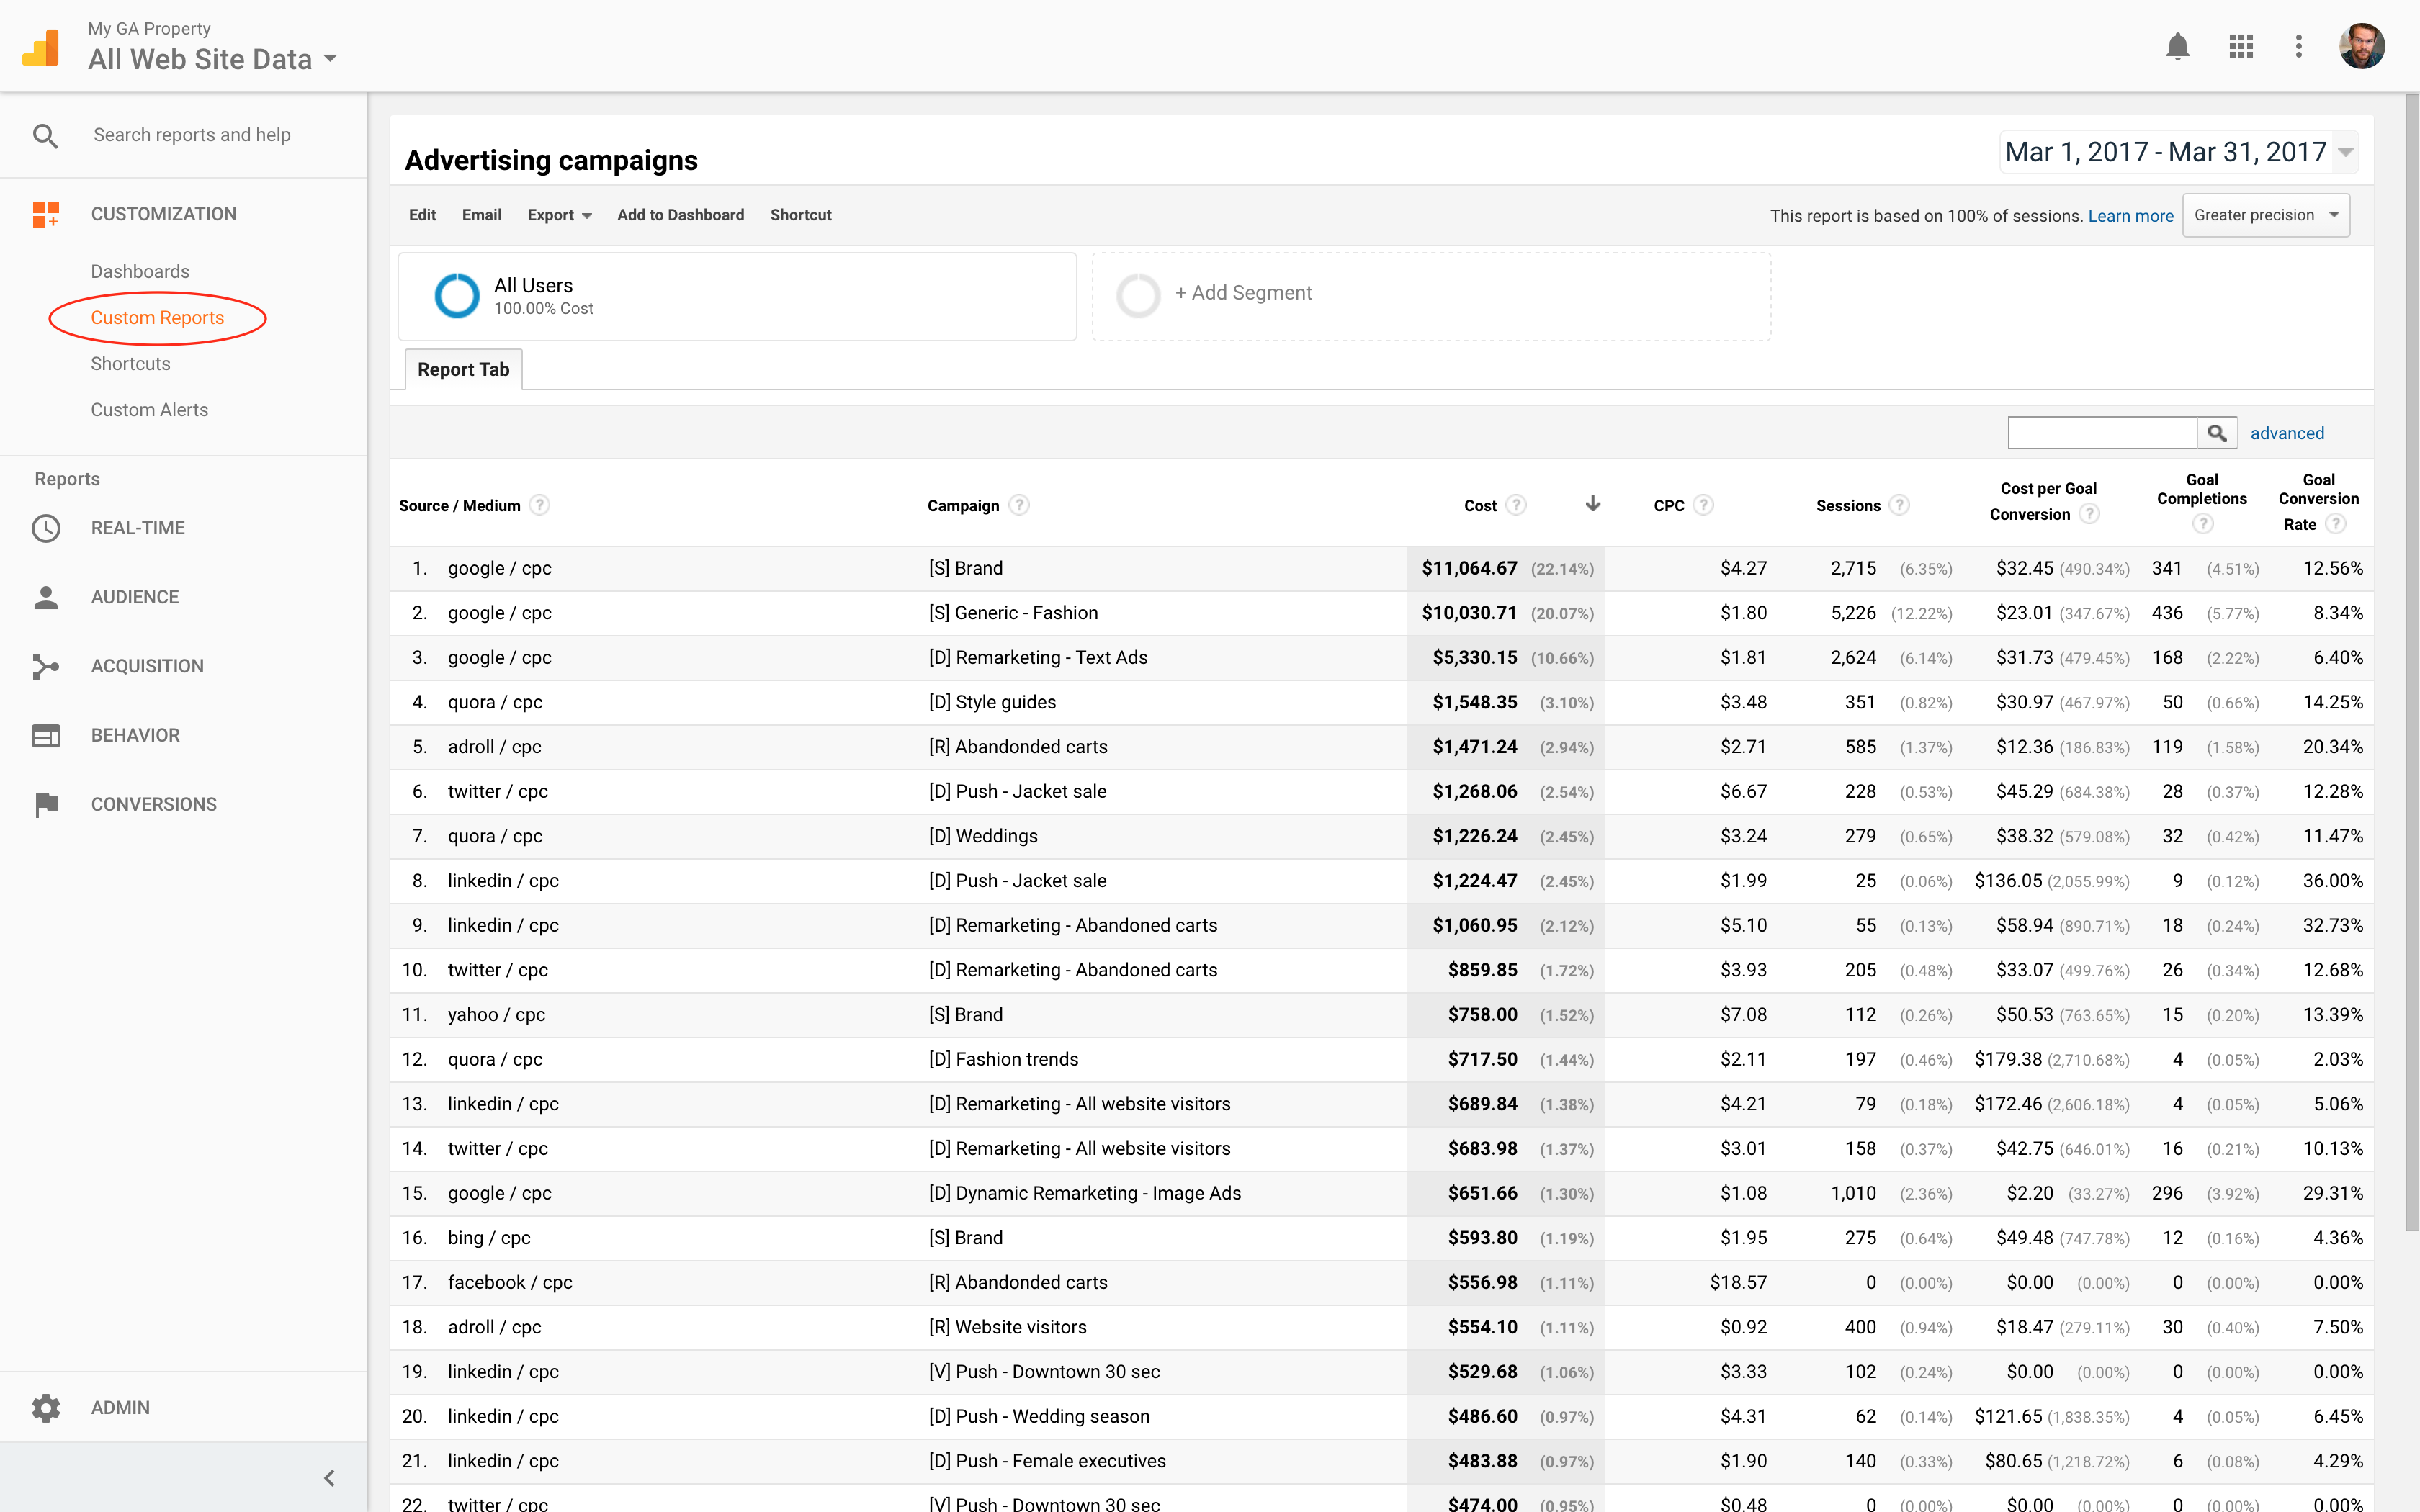
If you’re doing a more in-depth analysis of, for example, how your various advertising campaigns are performing, you could create a custom report like this:
It all of course comes down to what analysis you’re aiming for, but having the cost data available in Google Analytics adds an important part of the puzzle that’s not there by default.
An overview cheat sheet
To recap: imported cost data is available in two of Google Analytics report sections, as well as in dashboards and custom reports. For quick reference you can use this cheat sheet to get an overview:

I hope this run-through has been useful to you. Please feel free to add your questions or comments below!