

Contributors
Dimensions come in all sorts of shapes and sizes — literally. There are the dimensions you double check when buying furniture for your home. There are the multitude of dimensions from your favorite cinematic comic book universe. And there are the dimensions we encounter within Google Analytics.
While dimensions were a component of Universal Analytics, their significance has been amplified with the introduction of Google Analytics 4. This is mainly because GA4 introduces a range of new dimensions and metrics that were not available in the previous version. But what exactly is a dimension in Google Analytics, and how do metrics and dimensions work together?
Wonder no more. In this post, you'll get answers to all your questions.
Dimensions vs. metrics
You'll find both dimensions and metrics in your reports, audience, and segment builders within Google Analytics.
What is a dimension in Google Analytics?
Dimensions are data attributes that tell you more about the people visiting your website. For example, Google calls the gender of your website visitors a dimension. If 100,000 people visit your website, you can find out how many of those people are male or female.
What is a metric in Google analytics?
Metrics are quantitative measurements — things you can actually measure, such as pages per session or the number of page views. You'll find dozens of metrics on GA4 for advertising, e-commerce, events, revenue, and more.
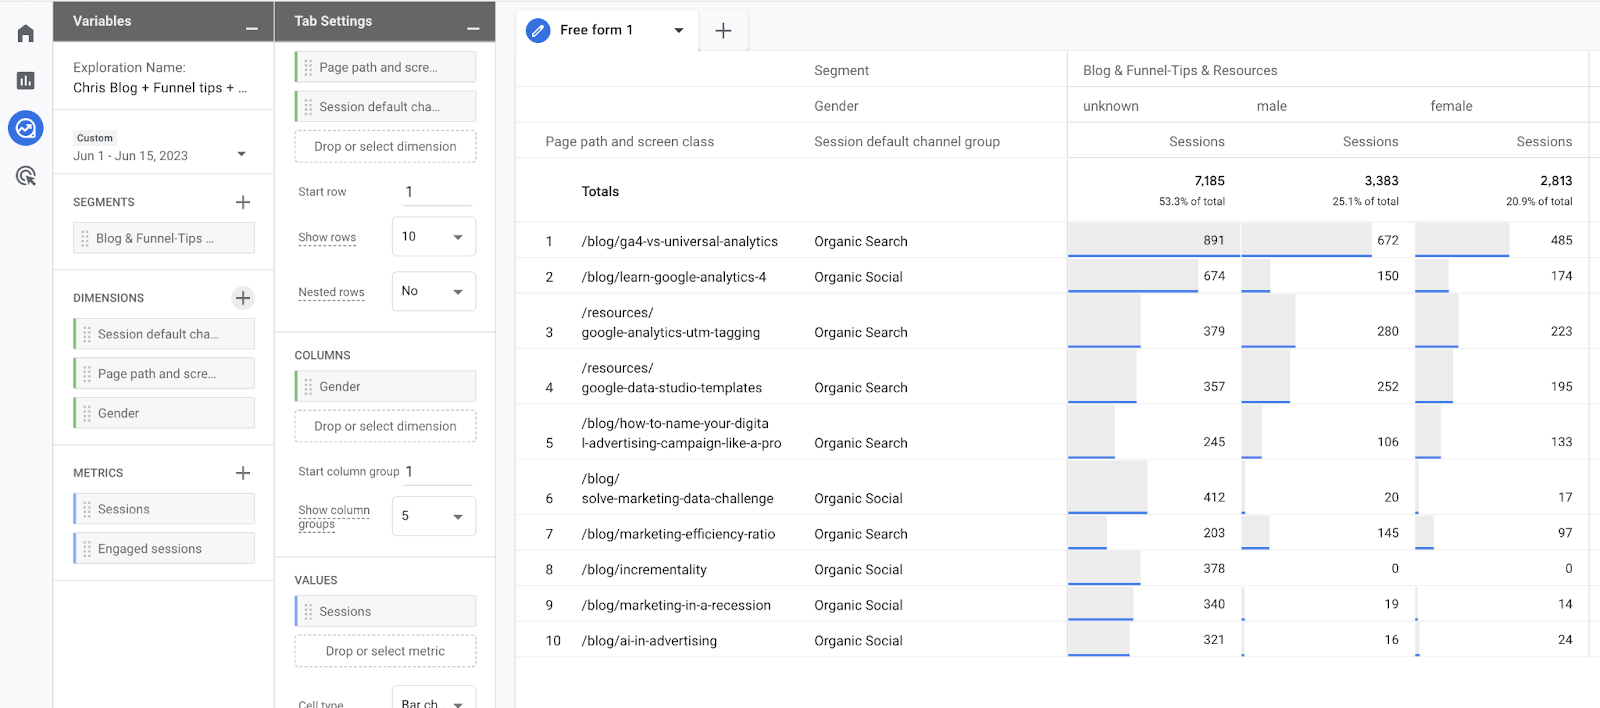
Screenshot showing from GA4 with three dimensions:
- Page title and screen class
- Session default channel group
- Gender
The first two are added as rows, while the Gender dimension is added to the table as a column.
Understanding metrics and dimensions
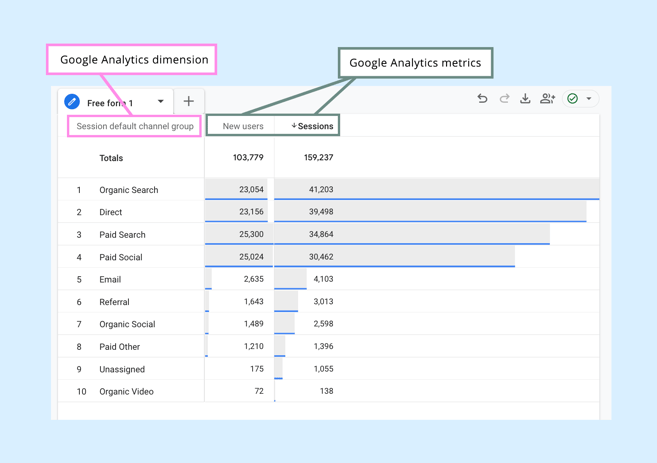
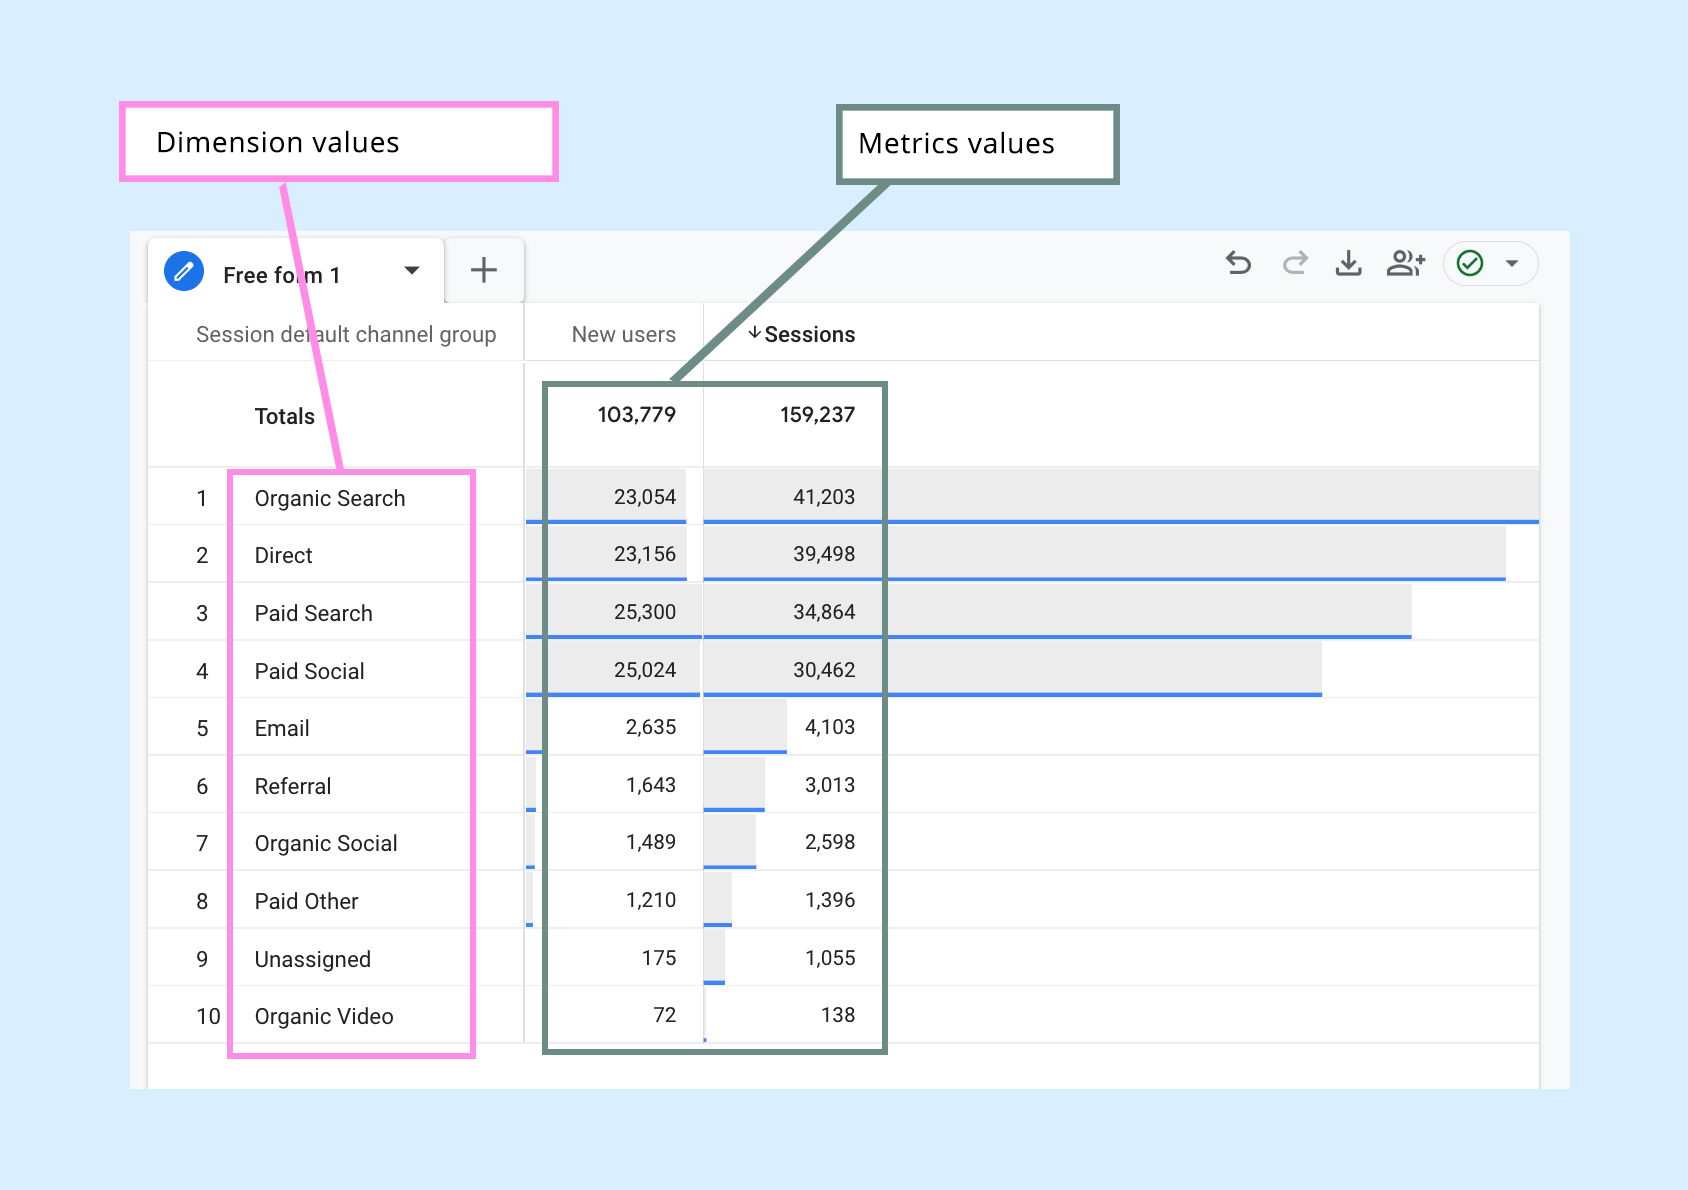
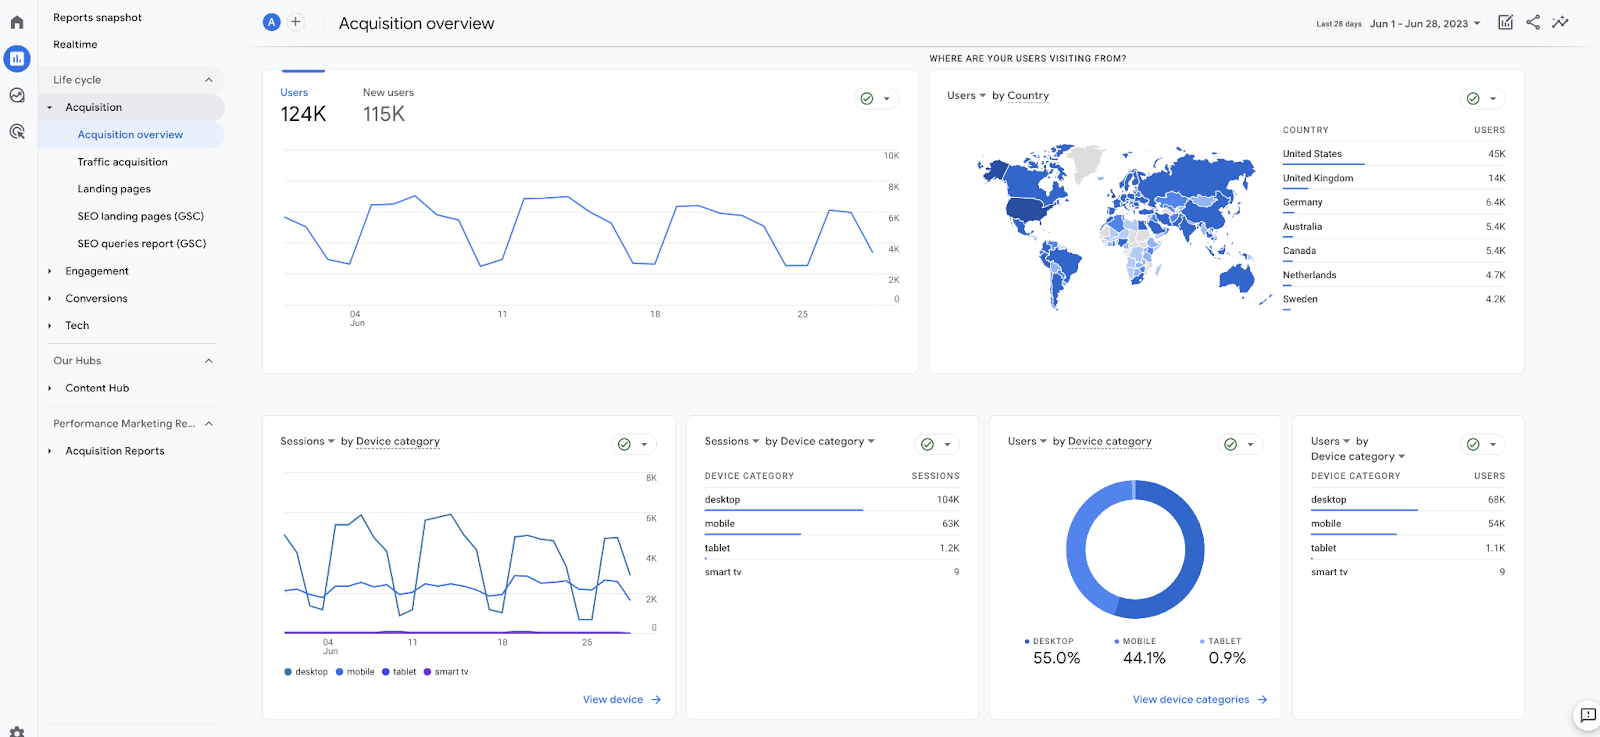
One way to understand this concept is to imagine it as a table. The table would have a metric, like the number of sessions or users, and it could be organized or divided into different categories or segments based on dimensions such as traffic source, geography, or platform device. See the example below that shows the metric (new users and sessions) broken down by a traffic source dimension.
You can use dimensions to gain valuable insights, and learn more about a site's visitors. You can choose different dimensions based on your specific marketing objectives. Here is a selection of default dimensions available in Google Analytics:
- City: The city from which a visitor originates
- Browser: The internet browser used by a visitor
- Device Category: The type of mobile device used by a visitor
- First user campaign: The marketing campaign that acquired the visitor
- Landing page + query string: The page path and query string associated with the first pageview in a session.
- Event name: The name of the triggered event.
The importance of the 'Event Name' dimension
The 'Event name' dimension records the specific action a visitor takes on your website. This can encompass a wide range of interactions such as button clicks, video plays, form submissions, or file downloads. Each event sent to GA4 has a corresponding 'Event name'. Understanding 'Event name' is crucial in GA4 for several reasons:
- Specificity: Event names allow you to drill down into detailed user behavior far beyond what standard page tracking offers.
- Key Events: With GA4, you can designate certain events as "Conversions" if they represent vital actions for your business. Analyzing the event names associated with conversions helps you understand what drives success.
- Custom Reports and Exploration: The 'Event name' dimension is invaluable for creating custom reports and explorations. You can segment and filter your data based on specific events.
Combining the Event name dimension with metrics
While 'Event name' provides the "what" (the specific action), it's essential to analyze it alongside relevant metrics like 'Event count' and 'Conversions' to understand the "how often" the event happens on your website. Here's how they work together:
- Event count: This metric reveals the total number of times each unique event (identified by 'Event name') has occurred. Together, you can see which specific interactions happen most frequently on your site.
- Conversions: When you define key events as conversions (actions critical to your business goals), analyzing 'Event name' within the context of conversions helps pinpoint what actions are driving success.
For example, the 'Event name' might be "add_to_cart." Looking at the 'Event count' for "add_to_cart" tells you how many times users added items to their carts. But, if you also set "add_to_cart" as a conversion, you can see how many of those cart additions actually resulted in purchases.
This combined analysis with 'Event name,' 'Event count,' and 'Conversions' offers a much deeper understanding of user behavior and helps you optimize your website for better performance.
Commonly used Google Analytics metrics
We have now quickly described the importance of the metrics 'Event count' and 'Conversions'. But, let's dive a bit deeper into the most used metrics. Here are some Google Analytics metrics you should know about:
- Sessions: A single visit to your website. A session can contain multiple page views, events, or transactions.
- Engaged sessions: The number of sessions that lasted longer than 10 seconds, or had a conversion event, or had 2 or more screen or page views
- Users: Total number of individuals who visited your site.
- Event Count: Tracks specific actions taken on your website (like video plays, button clicks, downloads, etc.).
- Conversions: Completed goals critical for your business (purchases, form submissions, subscriptions, etc.)
- Engagement Rate: The percentage of engaged sessions (Engaged sessions divided by Sessions).
- Average engagement time per session: The average duration a user spends actively engaged on your website.
- Total Revenue: If you have e-commerce tracking, this shows the total revenue generated on your website.
This is just the tip of the iceberg, though. You'll find dimensions for demographics, traffic sources, attributions, events, and much more. Check out this full list of dimensions and metrics.
Dimension name vs dimension value
A quick example to explain what is meant with 'dimension value' is the dimension 'Country'. The Dimension name is Country, and some dimension values for that dimension can be:
- United States
- United Kingdom
- India
It works similar with metrics. For example, the metric 'Users' may have a numerical value of 700 on Sunday, and 1260 on Monday.
It's important to note that Google Analytics dimensions are non-quantitative, because (unlike metrics) they are not calculations. There are some exceptions, though. For example the dimension 'Screen resolution', which has dimension values such as '1920x1080'. It is a numerical value, but it is still a dimension.
Getting started with dimensions in Google Analytics 4
You can view dimensions in Google Analytics in many different locations, including:
- In the left-hand columns of the data tables on your dashboard, which you can find by scrolling down past the graphs.
- By clicking on "Explore" in the left-hand menu and selecting dimensions.
- Using the Google Analytics Data API, which allows you to access your dimensions information from outside of Google Analytics. This can be helpful if you prefer to view data insights on a third-party platform like Funnel.
You can automatically populate some dimensions on reports and explorations in GA4. Other times, you'll need to populate dimensions using parameters. For example, if you want to use the "method" dimension, which tells you the method a website visitor used to sign up or log into your website, you'll need to populate the dimension with the method parameter.
Also, not all Google Analytics dimensions operate with all metrics, and vice versa. If you notice a dimension or metric is grayed out, it means it's incompatible with another dimension or metric you selected. You'll learn what combinations work well together as you become more familiar with GA4.
Analytics may prevent selecting dimensions or metrics in explorations by graying them out.
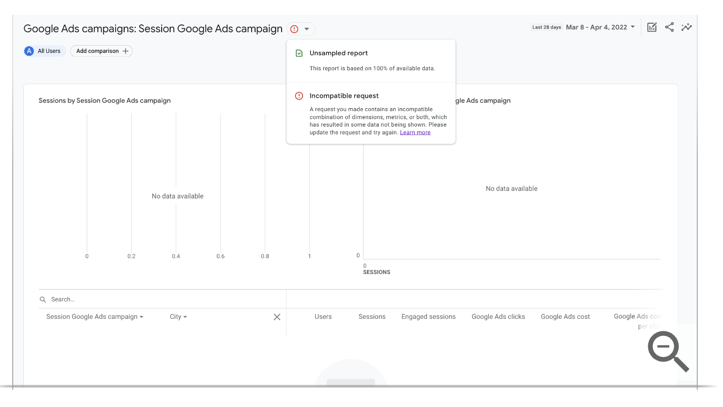
If you see "No data available" or a warning that the request is incompatible, it means there's no data for the specified criteria.
How metrics and dimensions work together
The trick is to combine dimensions and metrics to get a more comprehensive overview of all your website visitor data. Dimensions add extra context to the metrics you already use in Google Analytics, such as page views and customer churn. This context helps you learn about user behavior on your website.
Say you want to find out how many pages per session that males have accessed on your site compared to females. You can combine a dimension (in this case, gender) with a metric (pages/session) to learn this information.
Using secondary dimensions
Using a secondary dimension allows you to dive deeper than with just a single dimension, and create smaller 'buckets'.
As an example, say you want to know how many people visited your website after clicking an ad in a social media channel in the US vs the UK. You can see this by combining Google Analytics dimension 'Session default channel group' (known as the primary dimension) with the dimension 'Country' (the secondary dimension) with the metric 'sessions' to unlock this insight.
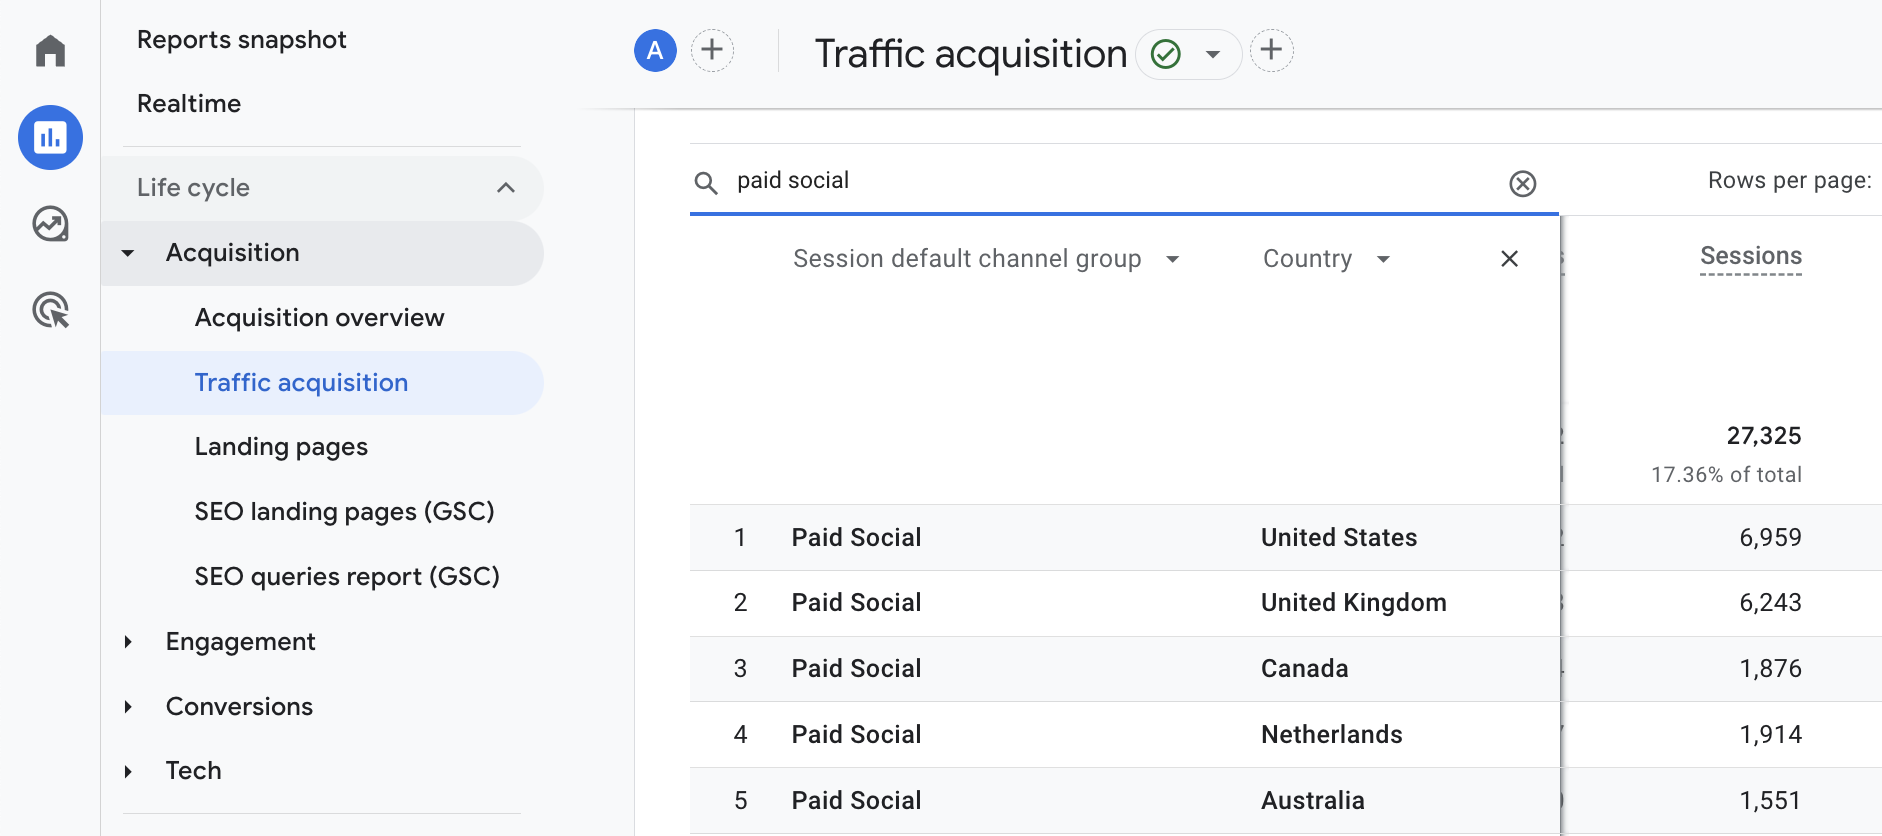
The primary dimension 'Session default channel group' is combined with 'Country' to get more granular data.
Standard reports
If you don't want to manually choose dimensions and metrics and just want an overview of your marketing, you can use GA4's reports. For example, you could use the user acquisition Google Analytics report to learn how many new people found your website and visited it for the first time. This report contains primary and secondary dimensions, such as:
- First user/source medium: The source and medium that resulted in new users arriving on your website
- First user campaign: The campaign that leads to new users arriving on your site
- First user Google Ads ad network type: The location of your ad that leads to new users arriving on your site
 Track new user discovery with the User Acquisition Report.
Google Analytics custom dimensions
Default GA4 dimensions are available for you to use right now, like those listed earlier in this guide. Custom dimensions let you analyze data that GA4 doesn't track out of the box. Then, you can dig deeper into how customers interact with your website and other online properties.
For example, you can create a custom dimension to understand if visitors have logged into your website or not. Or you might want to create custom dimensions to learn about users in the experiment variant of an A/B test.
You can create a custom dimension or metric by importing the data you want to analyze via a tracking code or the Google Analytics API. Just be aware that Google Analytics imposes limits on the number of custom dimensions and metrics for both premium and standard properties. For example, you can only create 25 user-scoped custom Google Analytics dimensions — dimensions that analyze user attributes on your website — in your Google Analytics account.
Also, if you want to more flexibility when creating custom metrics and dimensions, consider moving Google Analytics data to a third-party platform like Funnel. Funnel makes it possible to organize and transform your data, giving you more insights into your marketing performance and at the same time saving a lot of time on reporting.
Why you should know the difference between dimensions vs. metrics in Google Analytics
Knowing the difference between dimensions and metrics in Google Analytics is essential for every marketer. Combining them together allows you to create smaller buckets of data, and compare those buckets with each other. This way you'll generate more intelligence about your website and the people who use it. GA4 has plenty of dimensions and metrics already built into the platform and will likely add more as time goes on. Play around with the platform and see if you can track entire customer journeys from start to finish.
If you get stuck with dimensions and metrics, Google has plenty of resources—for example, step-by-step guides and video tutorials about how to set up custom dimensions. You can also check out Funnel's content library for more information about getting the most from GA4.
You may also find this interesting: How to diagnose Google Ads performance drops