Why are dashboards important?
Data is essential for any high-performance marketing team. The data on different campaigns you are running, will influence how you proceed with your marketing strategy. But with an infinite number of ways to reach customers, marketing budgets end up scattered across a large number of platforms, and subsequently, the data gets scattered too.
Marketing dashboards are the best way to centralize all this data, so you can easily monitor and generate business insights. By providing an overview of the most important metrics, they allow data-driven decision-making and give adaptability to the whole marketing organization. If you collect all the data you need, like website analytics data, marketing metrics and more, into one dashboard, you don't have to log into all the separate advertising platforms to monitor results.
Naturally, if a marketing configuration is made up of several moving parts it will require a robust solution that reliably connects all your platforms, regardless of whether it’s an advertising platform, a website, backend system, or CRM solution. In the past, marketers relied on specialized teams to collect, clean, and aggregate the data, but that is not good enough if you want to be able to adapt to changes and be in control.
Digital Marketing Dashboard & Metrics
The first thing to ask when building a marketing reporting dashboard is what matters most. That is, what metrics are really going to move your business forward. This varies from business to business, but if you are running an eCommerce business, the key metrics might look something like this:
Conversion metrics
-
Conversions (add to cart, website purchases)
-
Newsletter subscription
-
Clicks
-
CPC - Are we seeing any change
-
Spend
-
Website conversion rate - actual and budget
-
Email open and click-through rate
-
Conversion rate to deal by channel
Lagging metrics
-
Sales by channel
-
Deal volume by channel
-
Returns by channels
-
Repeat buy rate
Overview
-
Traffic split - Are we growing our organic traffic, how is it looking
-
Spend on target markets
-
Sales on target markets
-
ROI on target markets
Remember: It is always good to set a budget and target for the KPIs you want to measure. Depending on the outcome, these metrics can provide guidance on your strategy going forward. Your digital marketing reporting dashboard ideally shows you your KPI's compared to a previous period and relative to your goals.
A digital marketing reports dashboard should be easy to use and contain the metrics that are important to your organization. Or if you are working in an agency, the dashboard needs to reflect the priorities of your client.
Now, on to some marketing dashboard examples.
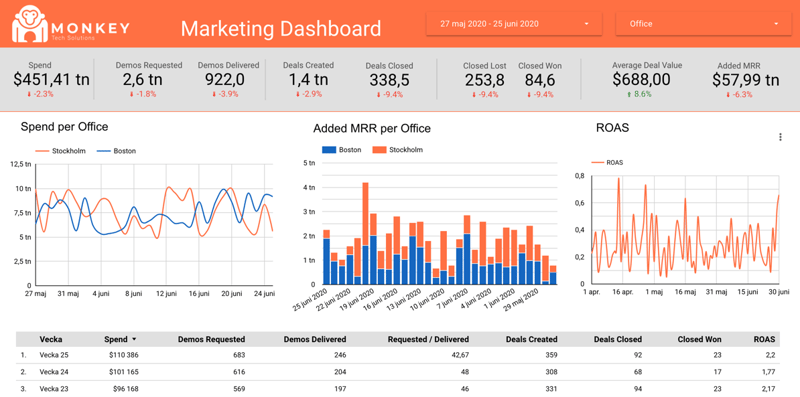
Digital marketing dashboard template
Link to this dashboard template
B2B Marketing Dashboard & Metrics
B2B Marketing is fundamentally different from a highly transactional business, like eCommerce. It often will have longer sales periods and the conversion might take several touchpoints. As a result, a B2B dashboard will involve different metrics. Often the main challenge is to tie marketing and sales data together, creating a holistic view to understand how marketing impacts sales. Some companies that fall into this space are consultants, professional services, and SaaS companies. When done right, these metrics give you guidance on which buttons to push for higher growth and revenue.
Leading metrics by channel/source
-
Conversions (signups, meetings)
-
Sales qualified leads
-
Clicks
-
CPC - Are we seeing any change
Conversion metrics for your dashboard internet marketing
-
Website conversion rate - actual and budget
-
Email open and click-through rate
-
Conversion rate to deal by channel
Lagging metrics
-
Revenue by channel
-
Deal numbers by channel
-
Days to won by channel
Overview
-
Traffic split - Are we growing our organic traffic, how is it looking
-
Spend on target markets
-
Sales on target markets
-
ROI on target markets
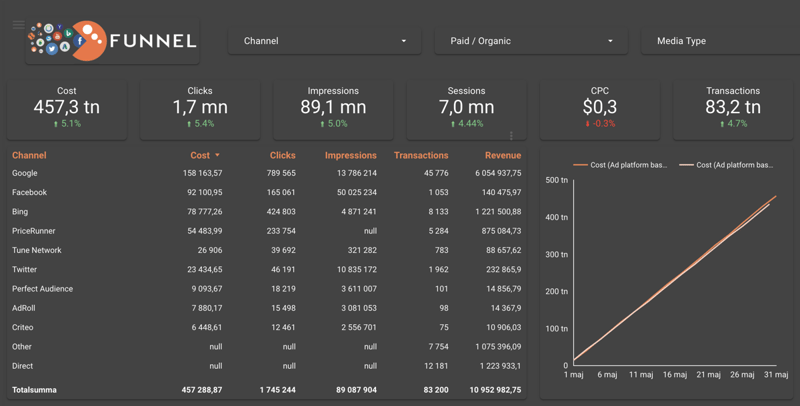
B2B marketing dashboard template